
Key facts:
Over the past two weeks, the price of BTC has been on the rise.
Bitcoin on-chain analysis allows us to distinguish how the market might continue.
While the price of Bitcoin (BTC) is still in a corrective sideways period for six months, the market is showing positive signs.
According to 3 metrics, The Bitcoin market may be facing a significant long-term turning point. This is indicated by a report from the analysis firm CryptoQuant made by the pseudonymous author Avocado.
The first metric is the 7-day simple moving average (SMA) of the fund flow ratio. This measures the difference between bitcoin transfers across the network and those made to or from exchanges. Thus, high levels indicate strong trading levels, while low levels indicate the opposite.
Currently, as the chart shows, this metric has bounced off the 0.05 level, which has historically served as its support. “This suggests that investors are starting to trade on exchanges again,” says Avocado.
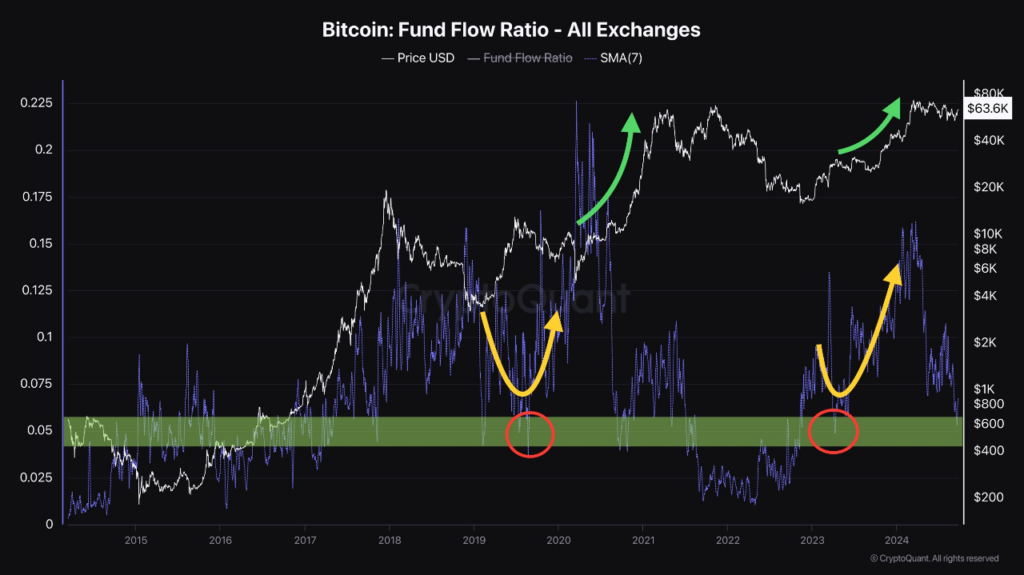
“This bounce typically occurs when a bear market or halving event concludes and a bull market begins, leading to significant long-term increases in the price of bitcoin,” the analyst explains.
Bitcoin volatility could increase
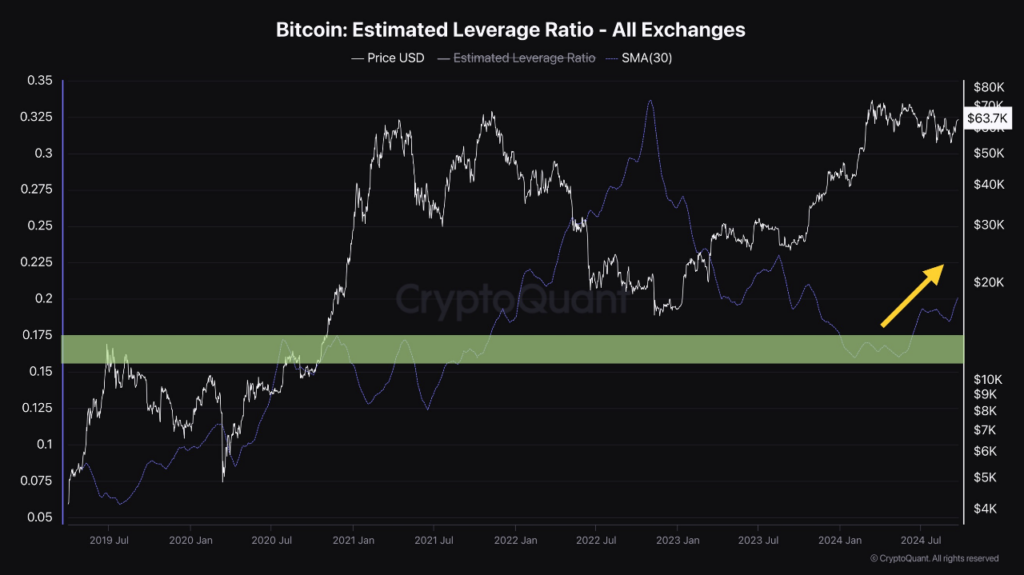
The second metric is the 30-day SMA of the estimated leverage ratio, which calculates the ratio of open interest divided by the reserve on exchanges. High results of this indicator suggest an overleveraged market and possible price volatility. Low results, on the other hand, indicate the opposite.
This indicator has formed a key support range between 0.15 and 0.175, from which it shows signs of recovery in recent weeks, as the chart shows. This anticipates greater volatility for digital currency. For Avocado, with the growing tools for trading bitcoin, the influence of this indicator will continue to grow.
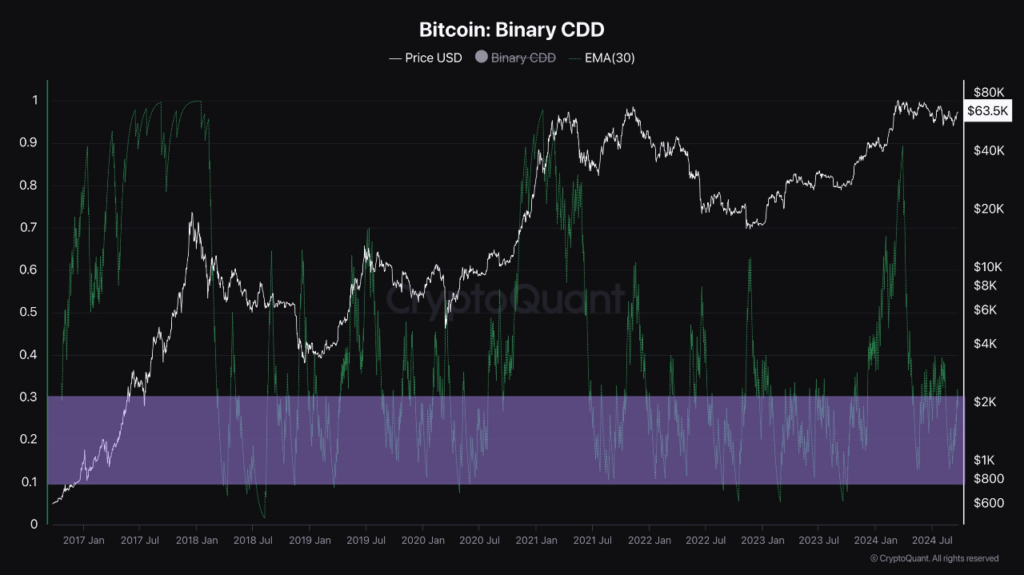
Added to this is, thirdly, the 30-day exponential moving average (EMA) of the indicator known as binary CDD. This shows when long-term holders moved their coins for a possible sale. On a scale from 0 to 1, it defines when such movements are larger or smaller than the monthly average.
As can be seen below, this metric currently moves between 0.1 and 0.3, indicating that Long-term holders are accumulating bitcoin. As a result, there is momentum for the price to continue to rise. “When this value increases significantly, it often signals the end of a bull market,” Avocado recalls.
“These support levels and recent movements are very positive from a long-term perspective,” the analyst concludes on the three metrics. Therefore, beyond the short-term development, he foresees a bullish outlook for the digital currency.
Meanwhile, the price of BTC, which is around USD 63,000, has shown an upward trend in the last two weeksas reported by CriptoNoticias. However, for the moment, it remains 13% below its all-time high, which was USD 73,700 six months ago.