
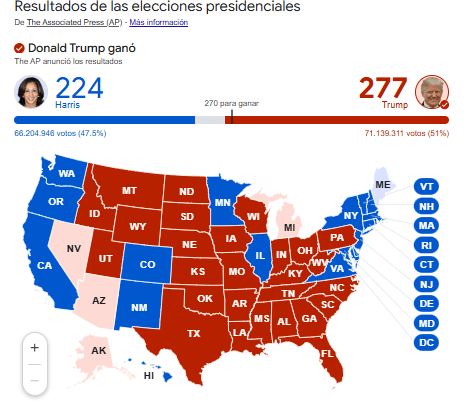
Donald Trump’s victory in the United States presidential election drove the price of bitcoin (BTC) towards a new all-time high (ATH).
Now, with this momentum, the digital currency entered unexplored territory, where there are no resistance or support zones.
As CriptoNoticias has reported, The market had a preference for a victory for Donald Trumpwho throughout his entire campaign showed a stance in favor of cryptocurrencies and even promised to create a strategic national reserve of bitcoin.
While the first results of the elections were known, the price of the digital currency created by Satoshi Nakamoto reacted upwards to surpass the all-time high of $73,400 which he had noted on March 14, 2024.
As seen in the following chart, the price marked a new ATH of $75,361 and at the time of publication the price is $73,880.
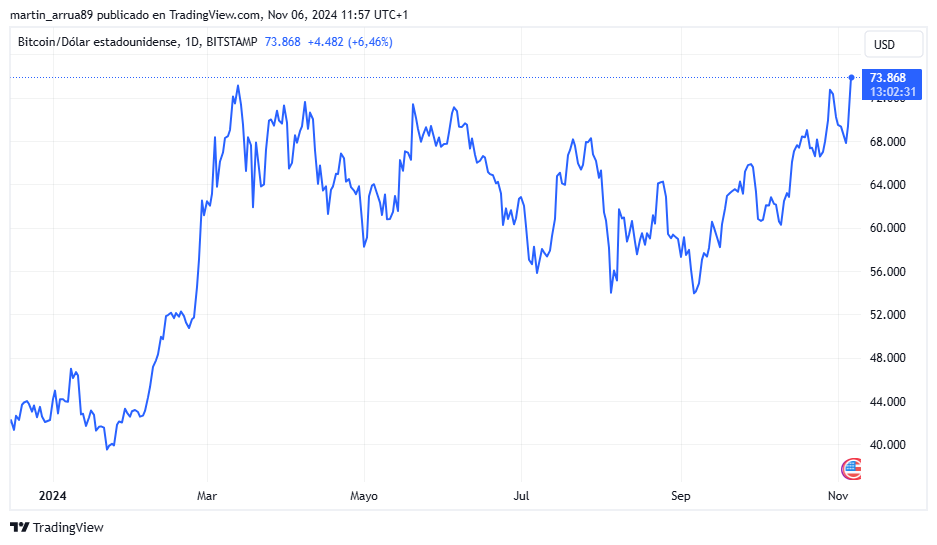
So things are, BTC entered unexplored territory for the simple reason that there are no support and resistance zones.
In trading, “support” and “resistance” are defined as a level or price zone that A financial asset reaches in certain circumstances that, for various reasons, it does not usually go through.
To explain it in more detail, support works as a kind of surface with which the price of an asset, in this case BTC, collides and then bounces or stabilizes. That is, its price does not usually go below that floor because selling BTC cheaper would be undervaluing it.
However, considering that bitcoin is in an unknown area, it is not possible to accurately identify a reference soil at this time. This means that there is no clear level where investors can expect the price to rebound and stabilize.
In technical analysis of financial markets, the term “resistance” refers to a price zone that an asset cannot easily overcome. These levels often repeat themselves due to patterns in market psychology and act as natural barriers to price action. Likewise, it is worth clarifying that Zones that were once resistances later become supports and vice versa.
Taking into account that the price of BTC is in an unknown zone, where there are no such previous supports or resistances to guide the next movements, a scenario of greater volatility is expected.
In this context, it is worth asking where the bitcoin price can go after Donald Trump’s victory in the United States elections.
How high can bitcoin go?
According to the latest report from Bernstein, a global equity trading research and execution firm, a Trump victory could push bitcoin to an estimated range between $80,000 and $90,000.
For his part, Iván Paz Chain, CEO of Trading Different, is also optimistic in the medium and long term. In dialogue with CriptoNoticias during LABITCONF 2024, he declared: “I am calmly projecting bitcoin above $140,000.” He had also stressed that the United States elections were going to play a fundamental role in the short term:
“No doubt during the election there will be volatility in the market, whether up or down, to take out the over-leveraged. After that volatility, the price will take its natural and organic path, which will probably be upwards.”
Iván Paz Chain, CEO of Trading Different.
The influencer Norberto Giudice, known as “Cryptonorber”, spoke with CriptoNoticias at LABITCONF and highlighted: “If Trump wins and, furthermore, if on November 7 the Fed lowers the interest rate by a quarter of a point, there we could talk about a super cycle where bitcoin would even go close to $200,000.”
Likewise, it is worth noting that in the indicator Bitcoin Halving Cycle Profit from the platform TradingView The digital asset could enter a bullish cycle, according to historical halving patterns. “This indicator streamlines the analysis of halving events, providing explicit signals for both profit-taking and dollar-cost averaging strategies,” the website describes.
As seen in the following image, the BTC price could enter a “super bullish” period starting on January 20, 2025, a date that coincides with the inauguration of Donald Trump to his new term as president of the United States.
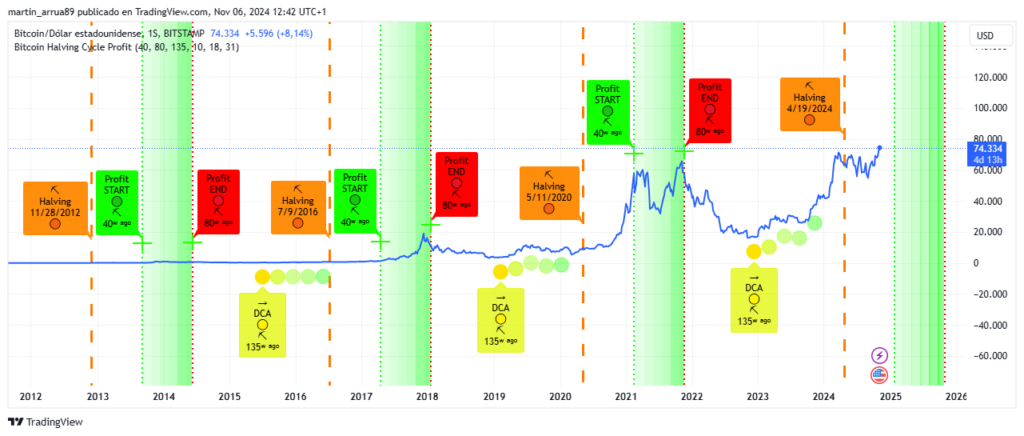
The graph shows with a square and an orange dotted line the beginning of the reduction event, in green the beginning of the so-called optimal zone of highest profitability and, in red, the end of that period.
CLARIFICATION: This article is written for informational purposes. It does not constitute an investment recommendation or financial advice. Each investor is responsible for conducting his or her own research.