
Woo uses Fibonacci bands to make his conclusions.
Despite Woo’s optimism, bitcoin could have bearish corrections.
With the arrival of the price of bitcoin (BTC) to figures above $90,000, a new all-time high was set. What’s next?
“When BTC reaches all-time highs, there is no history of resistance that allows the market to trade,” says the renowned analyst and trader Willy Woo. “This means that the price enters an unrestricted discovery phase, so sharp swings are expected,” he warns.
According to Woo, in these situations, you can count on 2 guides to find new resistances. These are the Fibonacci bands, which use repeated numbers from the universe, and the actual levels of liquidation of positions in the market.
According to these factors, the first target was USD 88,000 to USD 91,000. With the recent rise, “we reached it,” Woo notes. Therefore, he maintains that consolidation should occur in this area to be able to continue rising later.
This is due to both local Fibonacci levels and settlement levels, where most of the shorts (bearish positions), he explains. “It is the end of mandatory purchases by sellers in shorts that are being eliminated,” he says.
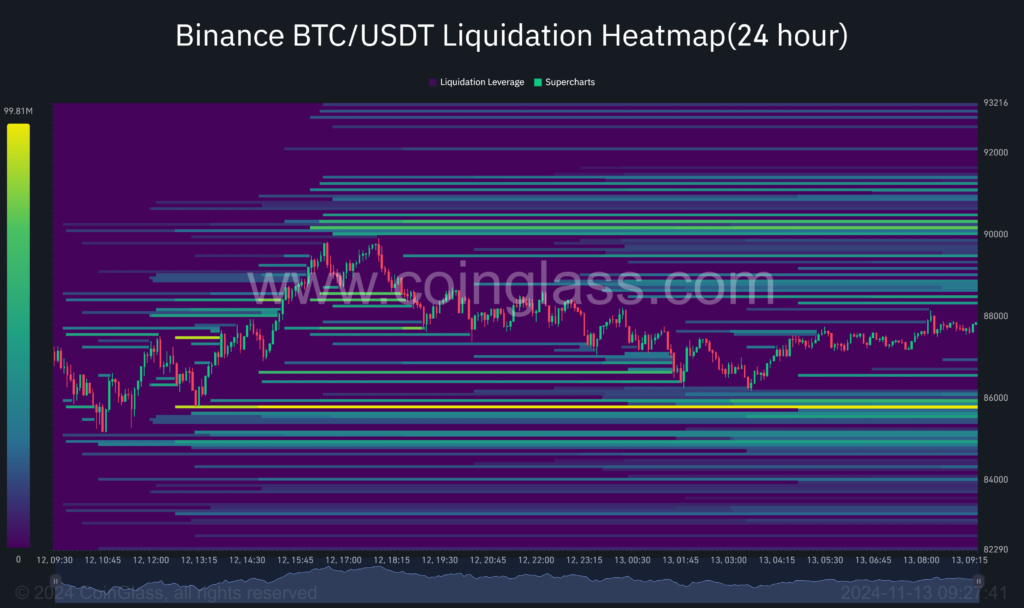
In fact, the liquidation heat map shows an accumulation of positions around $90,000, making it a potential strong liquidation zone, as seen below.
Therefore, according to Woo, the next target is USD 102,000. This is according to the next Fibonacci level based on the high of the last cycle and the low of the current one, he notes. However, he makes the reservation that it will be necessary to observe whether liquidations accumulate in such an area so that it functions as resistance.
“Let’s see where the new sell-offs cluster, but for now, that’s our next Fibonacci-based target,” Woo clarifies. “USD 88,000-91,000, then USD 102,000,” summarizes this analysis of the price of bitcoin.
Fibonacci levels and position liquidations help identify possible price movements because they mark critical areas where many investors tend to act.
Fibonacci bands, based on ratios such as 23.6%, 38.2%, 50%, and 61.8%, percentages of possible rises or falls stand out. These levels are frequently observed on price charts, reflecting market psychology and areas where buyers or sellers might be waiting to enter or exit positions.
Large position liquidation levels, on the other hand, are price zones that can trigger automatic closures of many leveraged positions. longs and shorts (bullish or bearish). This puts additional buying or selling pressure on the market, depending on whether the liquidations are long or short positions.
Settlement points usually coincide with support or resistance zones key, creating additional volatility. Therefore, this, in conjunction with the Fibonacci bands, provides a guide to anticipate price continuityespecially when the market is in a period of exploring new highs.
Bitcoin shows signs of overbought
Despite current bullish expectations, it should still be taken into account that there could be setbacks. In fact, the relative strength index (RSI), a metric that measures the momentum of price movements, indicates market overheating, as CriptoNoticias showed days ago.
As the following chart shows, the RSI of the bitcoin price per week is above the 70 level, which means that may be overbought. This type of phenomenon usually precedes a temporary decline before recovering to continue rising when the market is no longer overheated.
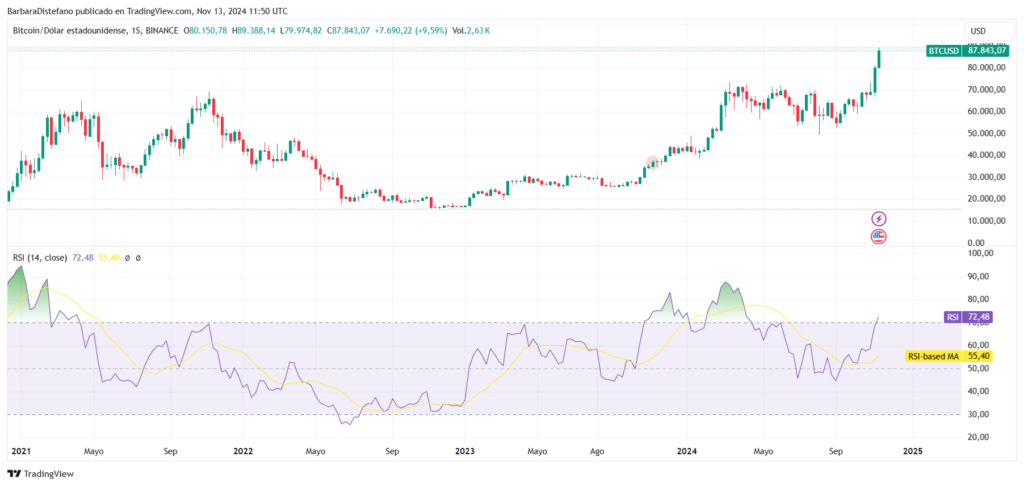
However, during some bullish bitcoin trends, the price usually increases due to growing demand despite showing signs of overheating. This happened, for example, both at the beginning of 2024 and at the beginning of 2021, as can be seen in the previous graph.
Therefore, it is crucial to keep in mind that indicators are not foolproof and traders must be prepared with a risk plan for any possibility. The price will always depend on supply and demand at any given time.
Clarification: This article is written for informational purposes. It does not constitute an investment recommendation or financial advice. Each investor should do their own research.

