
About $ 141,000 could expect a great sale pressure.
This weekend, Bitcoin showed a great resilience capacity.
Bitcoin (BTC) continues to consolidate below its historical maximum of USD 123,000, but, according to the analysis of the Glassnode firm, the market shows signs of resilience and preparation for an eventual upward break.
To clearly exceed the level of $ 125,000, The price could be directed without major complications around $ 141,000zone identified as the next technical and psychological objective where a significant sales pressure could be concentrated.
During the past weekend, Bitcoin’s market was tested by an extraordinary sale: A whale of the Sato Nakamoto era sold 80,000 BTC, equivalent to 9.6 billion dollars, through operations in Galaxy Digital, including OTC transactions, as reported by cryptonotics.
Despite the volume of the sale, the price of BTC only fell to $ 115,000 and then quickly stabilized at 119,000. The above, confirming the depth of liquidity of the current market.
This behavior not only evidenced the ability to absorb large volumes at times of lower activity, but activated a new maximum in the metric of networks made of Bitcoin, which reached 3.7 billion dollars, as can be seen in the following graph.
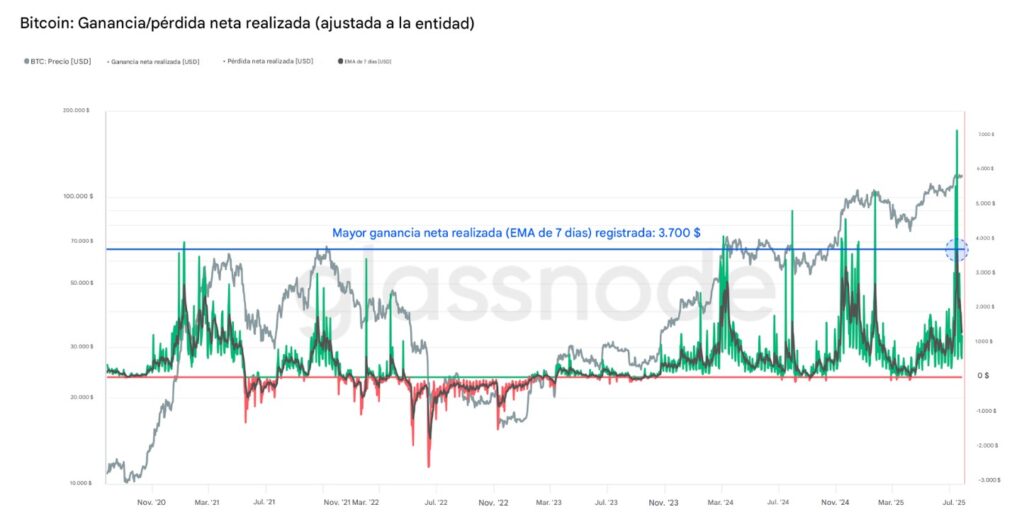
This type of peaks, although historically associated with moments of euphoria in the Bitcoin market, do not necessarily anticipate an immediate setback, but also They can precede additional extensions of the upward movementaccording to the Glassnode analysis.
In that sense, on-chain models used by Glassnode identify the range between $ 105,000 and $ 125,000 as a key consolidation zone. So breaking this rising strip would open through $ 141,000, a region that coincides with the level of +2 standard deviations of the cost of short -term investors, as seen below.
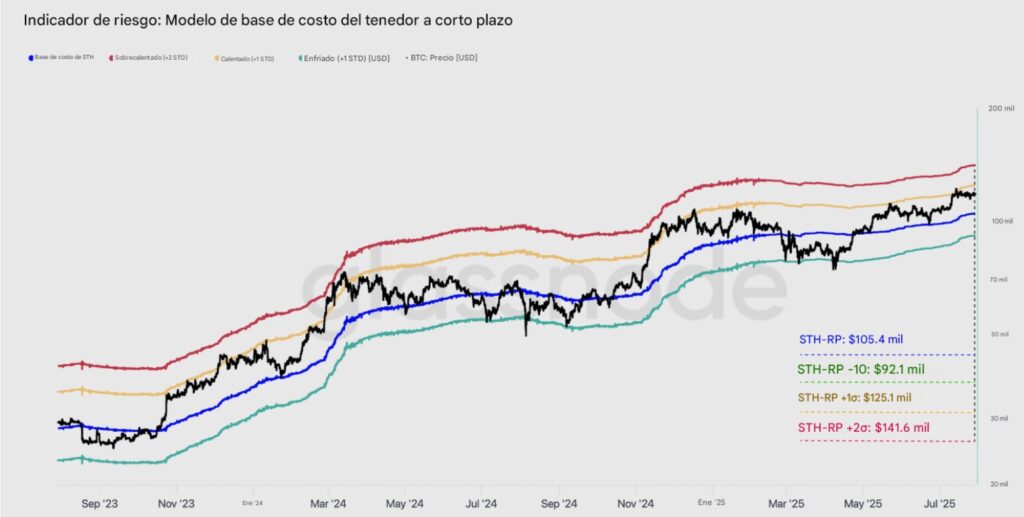
This strip has also historically worked as a roof in previous cycles, which makes it an important technical reference.
A relevant fact is that, currently, More than 97% of Bitcoin’s circulating supply remains unrealized. In monetary terms, that equals 1.4 billion dollars in benefits maintained by market participants.
This high level of accumulated profitability generates two effects: on the one hand, it supports the positive feeling for BTC contribution; on the other, it represents a latent sales pressure that could materialize if the price reaches higher levels.
There is still space to take profits
Also, Glassnode’s analysis highlights that, despite recent sales, Bitcoin long -term holders still maintain 53% of the total wealth on the network. It is a significant proportion considering the distribution volume already occurred, as can be seen in the graph below:
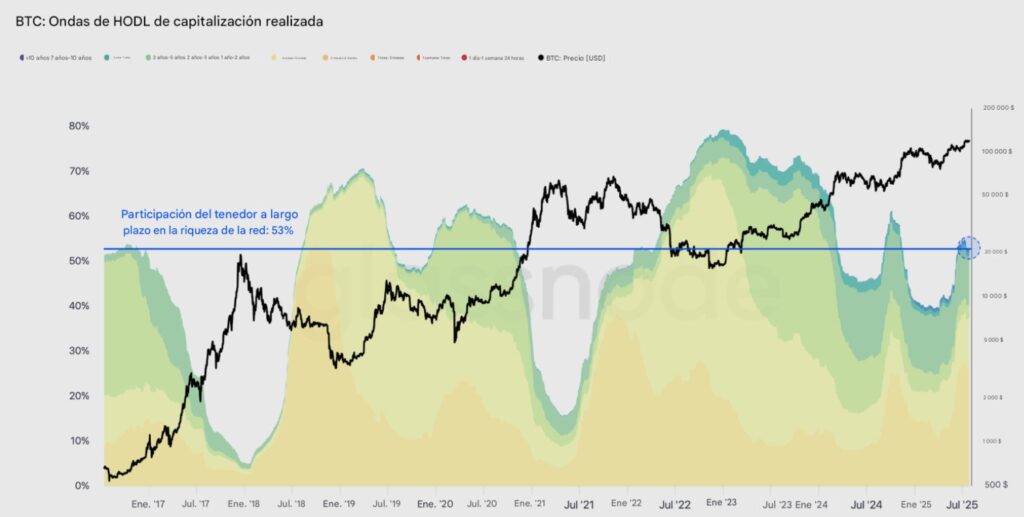
This suggests, according to the analytical firm, that there could still be room for more profits from these cohorts, especially if the price continues to ascend. Although for this a sustained demand will be required to absorb said offer.
It must be taken into account that, currently, Bitcoin faces a key resistance, which is that of the $ 120,000, because there is an important in -progress, especially by long -term investors, as cryptoics reported.
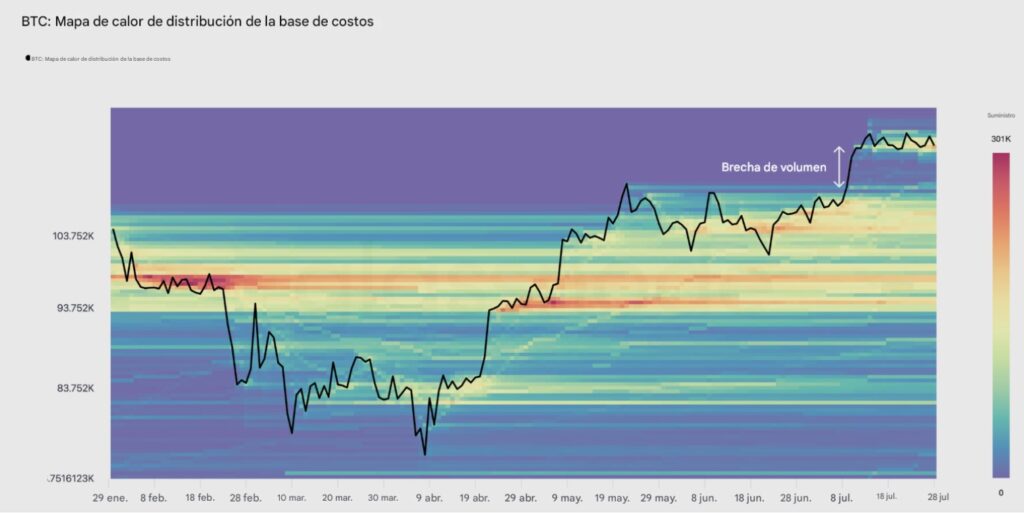
Another point of attention is the support zone between 110,000 and $ 115,000. This strip represents a “volume gap”, that is, a region where the price rose rapidly without leaving a significant activity mark. In case of setback, the price could return to this level to test whether there is a buyer interest, which makes it a critical area to observe.
From the point of view of the behavior of the new investors, the data are also optimistic. The current price is above the average acquisition of short -term holders, indicating that most newcomers are still profits.
In addition, the impulse within these sub -alcohortes, measured through the proportion of gain currencies, remains as an upward trend, suggesting that the market still shows signs of exhaustion.
Two key areas, a solid structure
In general, Bitcoin faces two key areas in its current structure. The first, a support between 110,000 and $ 115,000 that could be activated in case of correction. The second, a projected resistance at $ 141,000, where the high amount of profits unrealized could encourage benefits. Between both extremes, The price oscillates in a consolidation range that has so far been absorbed with strength.
Glassnode has already said that the current context of the Bitcoin market is “healthy, but fragile”, considering that there has been cooling of some profitability metrics, which could prolong the price consolidation phase, as reported cryptootics.
However, last week it shows that even historically high sales, such as the 80,000 BTC of the weekend, the market maintains its solid structure and its depth of liquidity. The key will now be to observe if the buyer impulse manages to take the price beyond $ 125,000. To achieve this, the next section can lead Bitcoin to a new phase of price discovery.
It should be noted that it is not the first time that there is a Bitcoin projection in USD 125,000. As reported by this media, in September 2024 the formation of a technical pattern known as “Cup with ASA” was confirmed in the price of BTC, which gave lights of a bullish trend that certainly concretized this year.
In that order of ideas, on-chain information and historical behavior suggest that bullish cycles do not stop abruptly after massive profits, but usually extend, although with less intensity. This implies that, although the path to new maximums could be enabled, The market must gradually absorb the selling pressure that will bring each new advance.
The Glassnode study concludes that, with a capitalization carried out greater than 1 billion dollars and a solid cost structure between the new and old holders, Bitcoin remains in a position of relative strength. However, the turning point remains the level of $ 125,000. Only a clear rupture above that roof would validate a new stage in the upward trend. Until then, consolidation continues.

