
Chainlink (Link) is one of the digital assets that is strongly resisting the tide that painted red to Bitcoin (BTC) and most of the cryptocurrency market.
The token of the decentralized oracles network Chainlink It is negotiated with a weekly rise of 2%. Not bad for a market that has shown weakness in most digital assets during the same period.
The following graph shows the price of Link since August 2024:
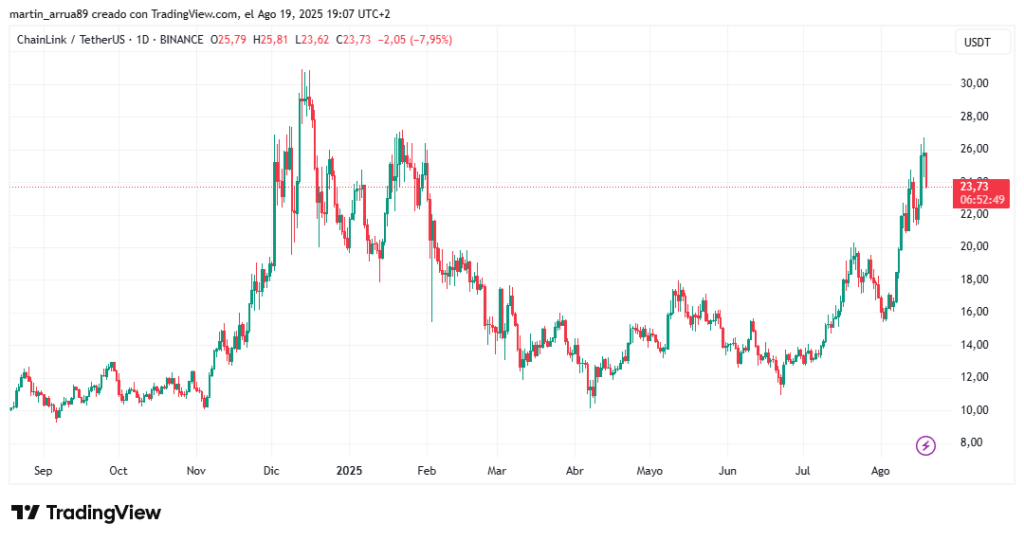
For specialists from Altcoin Vectora Swissblock analysis firm, “Link has remained firm in front of the bearish pressure and has never lost its impulse, thus becoming one of the large capitalization assets with the best performance.”
In that sense, analysts emphasize that Link exceeded the barrier of 30 dollars between the end of November and the beginning of December, but It was an “explosive and volatile” movement.
Now, the situation is different because the impulses from July to August “are more structured and harmonious”, which represents a healthy and elegant configuration for the asset. “With the market stabilizing, Link’s path to the 30 dollars resistance seems clear,” they emphasized.
This analysis is based on the impulse indicator developed by Swissblock, which measures the strength and direction of the trend of an asset. When the metric approaches +1 (in blue), it reflects a strong buying pressure that supports the upward movement; In values close to 0, the market remains neutral, without a clear direction; while approaching -1 (in red), evidence greater selling pressure and the possibility of falling falls.
At the bottom of the following graphic, It is observed that Link’s impulse is positive (0.41) and coincides with its price increase (shaded area).
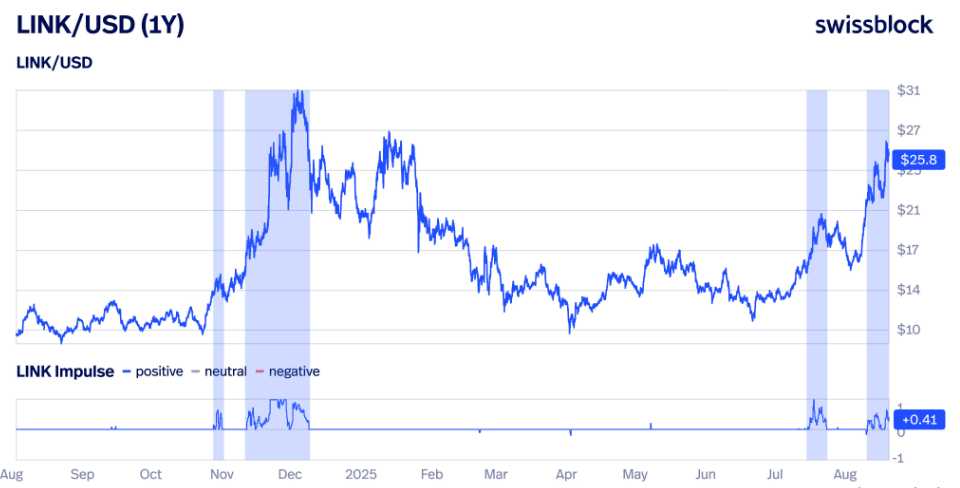
As seen, in November, the price and impulse have a very high and sharp peak (around $ 31 and about 1), followed by a quick fall. In July-August, The price rises to $ 25.8 with an impulse of 0.41, without such pronounced peaks or immediate falls.
For this reason, analysts speak of a “structured” movement (gradual changes) and “harmonious” (without chaotic oscillations).
Now, the good Link performance is explained, in part, because the ecosystem is immersed in tendency narratives: tokenization of real world assets (RWA).
In this regard, the analyst Milescher says that Link is positioned “as one of the clearest options to obtain profits in this market cycle.”
As cryptootics reported, the total blocked value (TVL) in RWA went from 1,000 to more than 13,000 million dollars in the last two years. It is one of the niches in the market with the highest.
According to Deutscher, the interest of large institutions is due to the limitations of traditional systems such as Swift and the need for unified infrastructure that reduces fragmentation. This has driven giants as Blackrock, who is strong for tokenizationalready firms like Stripe or Circle, who build their own networks.
Faced with this diverse scenario, Chainlink is positioned as the “connector” that facilitates that traditional assets, such as actions, bonds or goods, can interoperate in decentralized environments through their oracle technology.
This not only reinforces its role within the ecosystem, but it could also translate into a greater demand for link, promoting its price as institutional adoption grows.

