
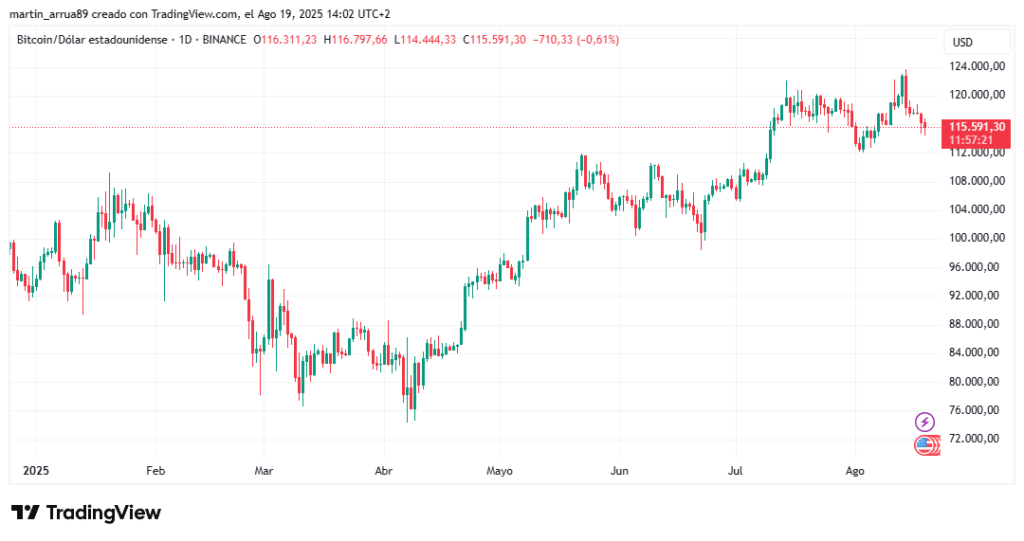
Bitcoin (BTC) marked a historical maximum (ATH) of $ 124,500 and then suffered a correction that carried its price below the $ 115,000 line.
After these sudden movements, The price of Bitcoin managed to stabilize in the range between $ 115,500 and $ 116,000.
The following graphic, provided by TrainingViewshows how BTC behaved throughout the current year:
In this context, according to Glassnode, an analysis firm ON-CHAINthere is signals that They show weakness for the price of the currency created by Satoshi Nakamoto In the short term.
On the one hand, there was a strong fall in the delta of the accumulated volume (CVD) in cash. This is a technical analysis tool that measures the difference between the purchase and sale volume of BTC over time.
If the indicator is high, it means that there is more buying pressure. Instead, if you go down, it is a sign that there is more saleswoman.
In the following graph, it can be seen that the CVD (blue line) has fallen to -87.8 million, which shows that aggressive sales orders have exceeded those of purchase in the market in cash.
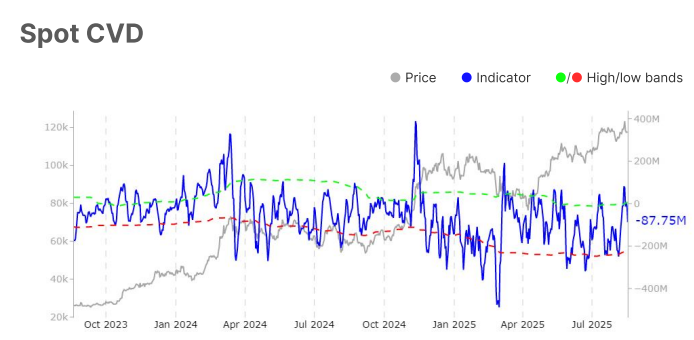
The fact that the CVD approaches the red dotted line indicates a market under the control of sellers, reinforcing a bearish bias and showing cooling signs in demand.
Glassnode analysts emphasize that, although the indicator returned to position themselves within their statistical range (between 5.3 million and -225 million dollars), the negative slope is clear and reflects a bearish feeling because buyers show a weakening in demand, while aggressive vendors maintain market control.
In the futures market, Open interest (OI in English) is at high levelswhich means that there is a lot of leverage. Although it does not define the price direction, this context usually anticipates episodes of volatility and, in the short term, represents a caution signal, since historically the OI peaks have resulted in disappointment processes. This is usually unstable for the future because a sharp price movement is enough for chain settlements.
Before continuing, it is worth explaining that the OI shows how many futures contracts are still active and serves to measure feeling, activity and liquidity, as Cryptonoticia explained. It increases when more new contracts enter than those that close, which reflects greater participation and volume in the market.
The following graph shows the OI, which shows the evolution of open futures contracts in the market.
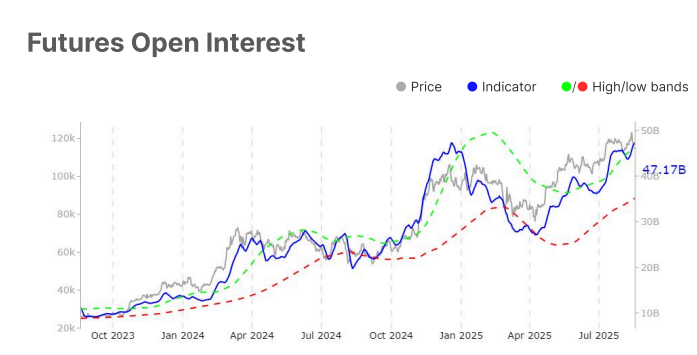
The gray line reflects the price of the asset, the blue line represents the total value of the OI, while the green and red dotted lines mark the statistical reference ranges: the green indicates historically high levels of open positions and the red, low levels.
Currently, the OI rose to 47.2 billion dollars, exceeding the green band of 46.2 billion dollars, indicating a very active market but also more exposed to episodes of volatility and possible liquidations if an abrupt adjustment occurs in the price.
The report also highlights that user activity and active addresses in the Bitcoin network decreased in the last week. In this regard, analysts say: “The counting of daily directions fell from 798,000 to 717,000, a 10.1% reduction that places the metric near its lower statistical band of 711,000. This fall suggests a more moderate activity on the network, with less users making transactions ON-CHAIN. The proximity to the lower limit highlights the decrease in speculative activity and the weakening of short -term enthusiasm. While this cooling may reflect temporary tiredness of the market, it also indicates a contraction in user participation. ”
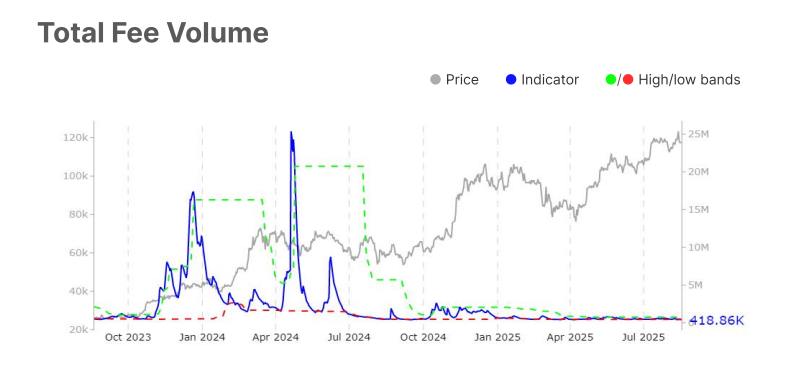
Likewise, it should be noted that The volume of network commissions fell from $ 512,100 to $ 418,900 in 7 daysa 18.2% decrease that places the metric near its lower statistical band of 433,600 dollars. “This position suggests a lower transaction pressure and a lower intensity of use, which points to calmer market conditions. Contraction in the volume of commissions reflects a decrease in the demand for space in the blocks, which could indicate a cooling of the activity ON-CHAIN And a weaker organic demand for network resources, ”explains the report.
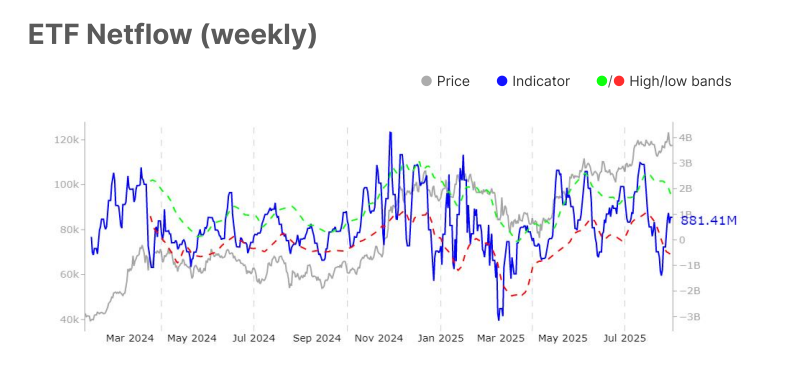
For Glassnode analysts, it will be essential that they remain high Capital entries in the BTC -listed in the BTC stocks (ETF) in this context of high price volatility. In this regard, they point out: “ETF flows experienced a strong recovery, with more than 880 million dollars in weekly tickets, accompanied by a higher negotiation volume.”
Finally, analysts propose two scenarios for the price of BTC: “With the increasing benefits, the sustainability of institutional flows and the renewed conviction of buyers, both in the market in cash and in that of futures, will determine whether this contraction is stabilized in a new upward impulse or extends towards a deeper consolidation.”
Said in simpler terms, although the activity gives bassist signals, the behavior of institutional investors and the reaction of buyers in the next few days will be key to defining If BTC strongly takes up the bullish impulse or enter a longer correction phase.

