
The weekly Moving Average Convergence/Divergence (MACD) indicator for bitcoin (BTC) is approaching a crossover that has historically coincided with price increases.
As seen in the following TradingView chart, the MACD moving averages are close to crossing, movement that could be confirmed at midnight on Sunday if the current behavior of the bitcoin market remains bullish or, at least, sideways.
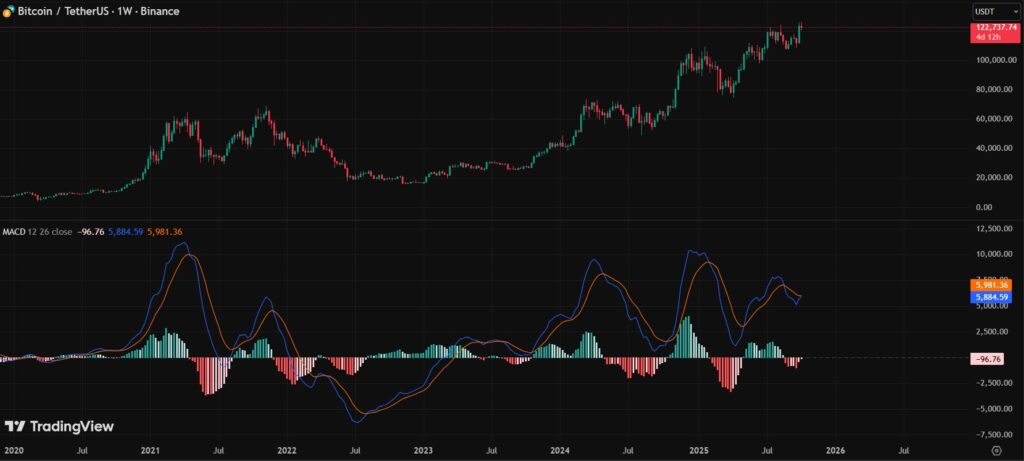
The MACD measures the difference between two exponential moving averages (in this case a fast one of 12 periods and a slow one of 26 periods was established). When the fast line crosses over the slow one, It is interpreted as a sign of positive momentum. And when the opposite happens, it is associated with loss of purchasing power.
On weekly charts, this crossover usually has medium-term implications and is watched by technical analysts to anticipate trend changes.
Currently, the price of bitcoin remains above $122,000, while the MACD shows decreasing negative bars, suggesting loss of momentum bassist. If the blue line manages to position itself above the orange line at the weekly close, a new technical buy signal would be confirmed.
The historical behavior of the technical analysis indicator does not guarantee future results, but its past performance has given it relevance in trend analysis. In the last five occasions since 2019, Four bullish crossovers in this time frame preceded significant price movements.
Attention now focuses on the close of the weekly candle, which will define whether the MACD confirms the signal. If it occurs, could imply a new cycle of momentum for the bitcoin marketin a context where the currency maintains its structure of ascending highs on the weekly chart.
The technical performance of the market adds to other fundamental variants that suggest that BTC still has a way to go in this bullish cycle, before reaching new highs. Analysts consulted by CriptoNoticias argue that the digital currency could reach prices of up to USD 200,000, as is the case of economist Daniel Arráez. Others, more cautious, such as Emanuel Juárez, suggest that BTC could climb to USD 150,000 this year.