
According to Glassnode, there is no “coordinated attack” by old bitcoiners to bring down the price.
The decline can be attributed to a lack of consistent new demand.
The recent selling pressure seen in the market has sparked theories about an alleged concerted action, or “coordinated attack,” by older bitcoin (BTC) investors in order to cause a drop in price.
While some suggest that so-called “old whales” are selling off en masse, or that the digital asset is undergoing a “quiet IPO,” on-chain data reveals a more complex picture.
The on-chain analysis firm Glassnode put into perspective these movements. This complexity lies in the distinction between normal profit-taking behavior and a supposed exodus of large capital.
Long-term investors, those with historically profitable positions, have been consistently making profits throughout the current cycle, behavior that Glassnode says is identical to all previous cycles.
As seen in the following graph, the current pattern (cycle 5) is not an anomaly, but a continuation of the distribution pattern seen in previous cycles.
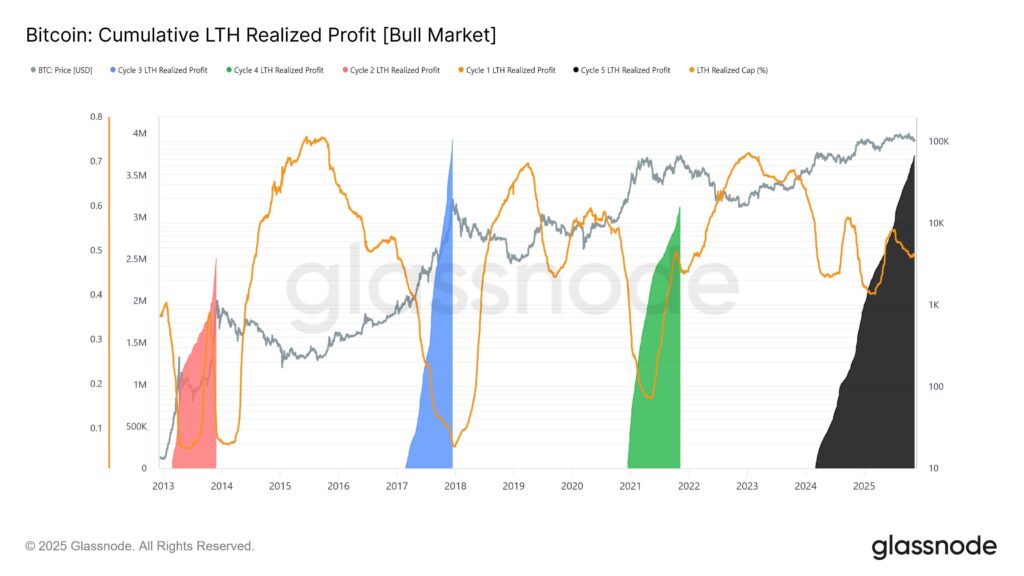
Long-term holders of bitcoin
The increase in the magnitude of profits obtained by experienced investors, after exceeding the historical maximum, is aligned with the peaks of previous cycles. Glassnode emphasizes that this phenomenon “is not an anomaly, nor specifically a ‘seasoned investor sell-off’, but rather normal behavior of a bull market.”
A study of the average monthly spending of long-term holders (LTH) of bitcoin shows a constant upward trend in the distribution. “Capital outflows have increased from approximately 12,500 BTC per day in early July to 26,500 BTC per day today (30-day SMA),” the firm details.
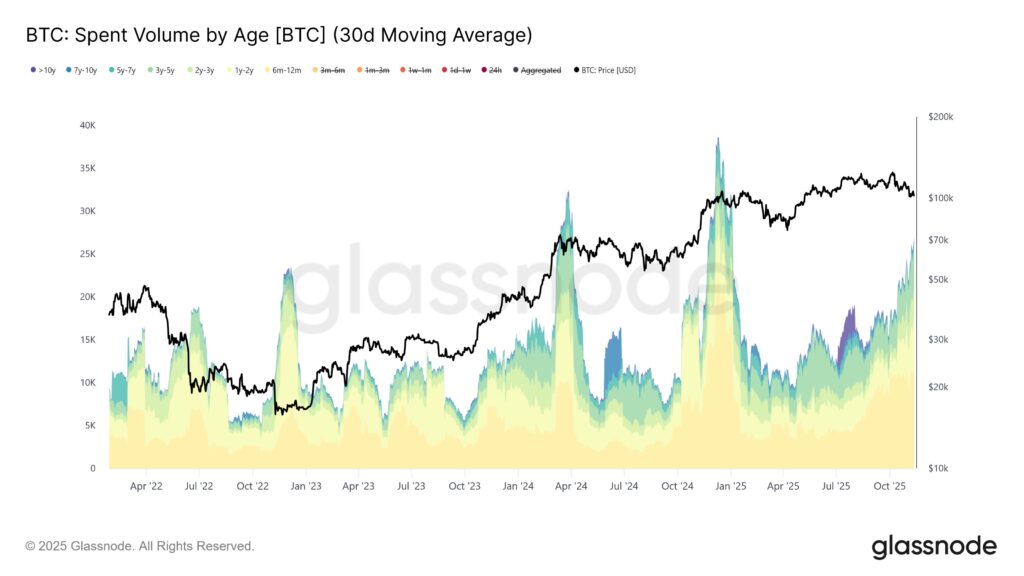
This steady increase in spending activity “reflects growing distributional pressure from older investor cohorts; a pattern typical of profit-taking at the end of the economic cycle, not a sudden exodus of large investors.”
Even when isolating the most significant transactions, such as those from whale wallets more than 7 years old that spend more than 1,000 BTC per hour, the data does not indicate a break with the past. Glassnode states that “These large expenditures were not unique to this cycle; they have occurred in all major bull phases.”
The main difference lies in the frequency, as spending events of more than 1,000 BTC by these whales have appeared “more regularly and more uniformly, pointing to a persistent and staggered distribution, not a sudden and coordinated ‘sell-off’.”
Bitcoin Custody Turnover Versus Selling
Ki Young Ju, CEO and founder of the firm CryptoQuant, offers a perspective optimistic by ensuring that “bitcoin is not in a bear market as long as capital continues to enter.”
In the graph below, the realized capitalization line (purple) shows a strong and consistent trend over time that capital flow is maintained in bitcoin.
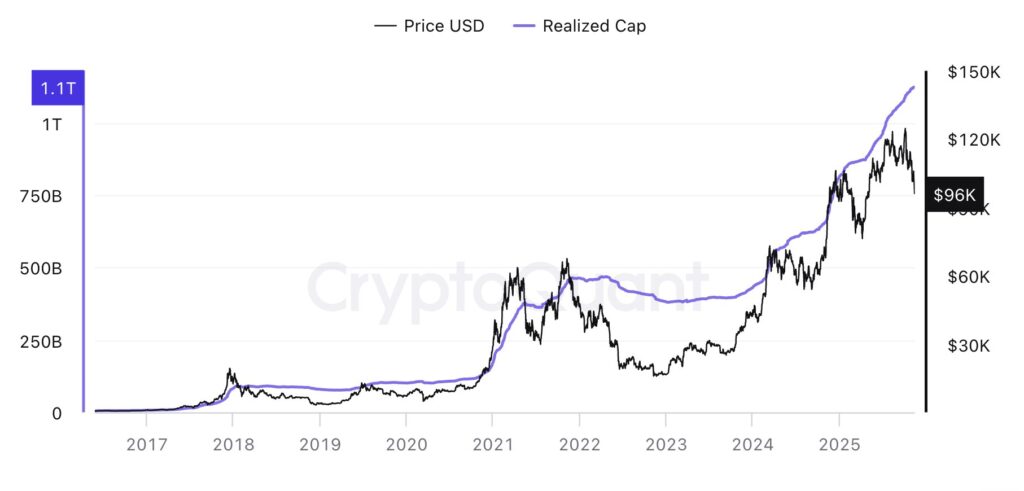
Despite the selling pressure of LTH, the flow of capital towards the digital asset continues. Ki Young Ju believes that “if the original whales stop selling and macroeconomic sentiment changes, bitcoin can recover at any time.”
On the other hand, analyst Willy Woo questions the very validity of the “long-term headlines” metric, as reported by CriptoNoticias. For Woo, the LTH supply indicator “has become obsolete” and leads to misinterpretations.
The analyst argues that the definition of the term “is a conceptual error. It is defined as any currency that has been held in one direction for more than five months. He concludes that “everyone is alarmed by a graphic with a misleading name.”
Woo proposes that what is interpreted as a sale by former investors could, in reality, be a “custody rotation” process. This involves moving coins to new storage structures, such as wallets with better security or to corporate entities and treasuries. Woo flatly states that “the decline in long-term supply reflects custody turnover, not sales. This phenomenon was much greater in 2017. In fact, it is a sign of strong bull markets.”