Various bitcoin metrics show signs of stabilization.
“Sentiment and positioning in bitcoin remain cautious,” says Glassnode.
Bitcoin (BTC) continues to stabilize after recent bouts of volatility, in what analysts describe as an early recovery phase.
The most recent report from the market analysis firm Glassnode maintains that, despite the rebound from the USD 80,000 area, “sentiment and positioning in bitcoin remain cautious.” This, in line with a market that “is still rebuilding confidence” after weeks of downward pressure.
Glassnode notes that price momentum has improved. The 14-day Relative Strength Index (RSI), which measures buying or selling intent, rose from 38.6 to 58.2 over the past week, reflecting an increase in buyer push. According to the report, this movement “signals a momentum ascending and a stronger participation of the buying side”, without the asset entering overbought zones.
However, this recovery coexists with signs of weakness. The Spot Cumulative Delta Volume (CVD) indicator—which measures whether aggressive orders are coming mostly from buyers or sellers— fell in the last seven days, to -111.7 million dollars. A decrease of 173.7% compared to the -40 million registered the previous week, as can be seen below:
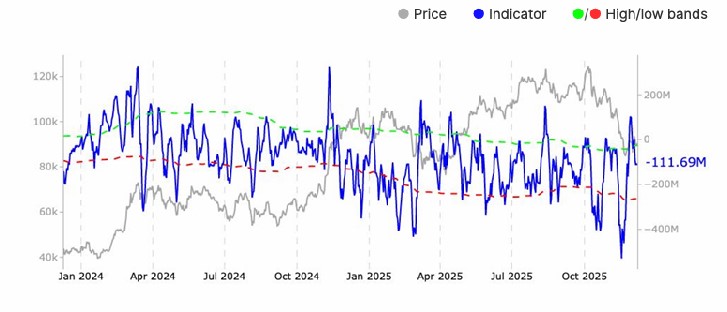
Glassnode explains that this decline implies “a clear increase in aggressive selling pressure,” suggesting that The price rebound is sustained on still fragile foundations.
Likewise, the volume traded in spot markets increased 13% in the same weekly period, which shows a higher level of activity. In simple terms, an increase in volume indicates that more participants are trading, which is often associated with periods of recovery or consolidation. Even so, the deterioration of the CVD reflects that, although there are more transactions, Those who take the initiative continue to lean toward selling.
This behavior agrees with what CriptoNoticias previously reported on the forced sales cycle. After an accelerated sell-off, the market usually goes through a period of stabilization in which buyers and sellers seek a new equilibrium point.
Derivatives and ETFs show caution, although with increasing activity
In the futures market, The open position decreased slightly to USD 30.6 billion. For Glassnode, this weekly decline “signals a reduction in speculative positioning and a moderate turn towards risk-averse behavior.”
In simple terms, fewer open futures means traders are using less leverage, reducing possible sudden movements derived from liquidations.
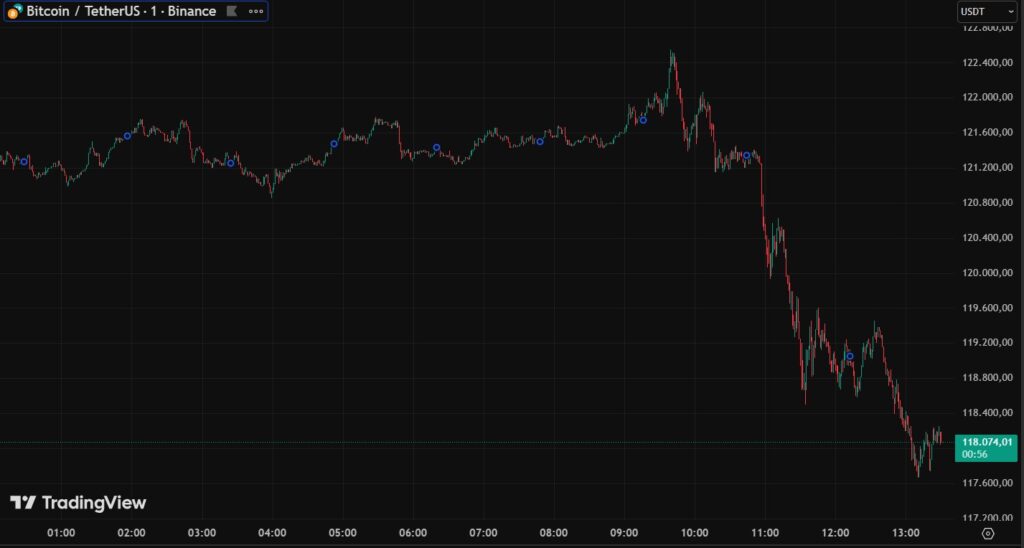
The latter is especially relevant because a large part of the bearish movements recorded by bitcoin in the last three months have been due to liquidations by leveraged traders. This was evidenced on October 10, when leveraged positions worth USD 19 billion were eliminated. It was the largest daily liquidation of bullish positions in history, with more than 14,000 positions forcibly closed.
This scenario caused a bearish reaction in BTC, which at that time was trading above USD 120,000, taking it to USD 117,000 in a matter of hours. This drop is better seen in this graph:
There is expectation and confidence in a bitcoin price recovery
Coming back to today, Glassnode highlights that funding rates rose towards the buy side in the last week, indicating that those holding long positions are paying more to hold them. This usually happens when there is an expectation of price recovery.
Defensive signals persist in the options market. The report highlights that the demand for downside protection increased, as the 25-delta skew rose to 12.88%. This indicator measures whether traders prefer put options over call options. An increase in the skew reflects a greater need for coverage against possible declines.
On the other hand, bitcoin ETFs in the United States registered a marked turnaround. They went from a weekly net income of USD 134 million to an expense of USD 707 million, as seen in the following graph.
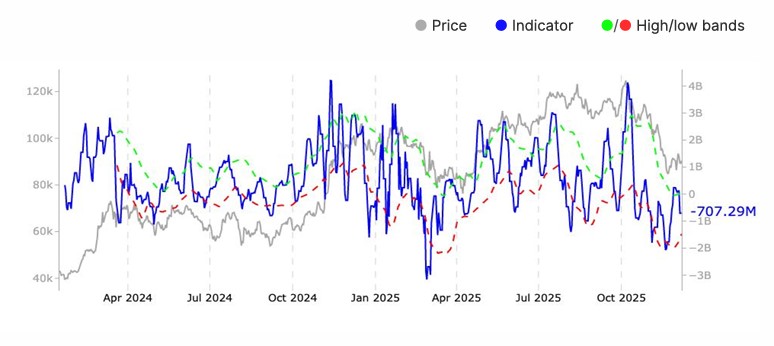
Glassnode notes that this change “represents a clear headwind” for the market, showing that Institutional investors take profits or reduce exposure.
Nevertheless, ETF trading volume increased more than 21%. This data is relevant because an increase in volume, even with net outflows, indicates an active market, where large investors continue to adjust positions instead of withdrawing completely.
Network indicators show incipient stabilization
In Bitcoin on-chain analysis, fundamental metrics also portray a transition scenario. The active addresses rose slightly to 693,000an increase that Glassnode describes as “stable but contained activity.” This indicator reflects how many addresses are sending or receiving bitcoin, and usually serves as a thermometer for real use.
The transfer volume adjusted by entities—which discounts movements between own addresses—grew 17% in one week, which aims for greater circulation of value within the network. Meanwhile, commissions paid decreased almost 3%, suggesting less congestion and a phase of less transactional urgency.
Another key indicator is the Change in Realized Capital, which fell to 0.7%. This value measures the rate at which fresh capital enters the market. A drop of this type, Glassnode notes, “indicates a consolidation phase, with lower capital inflows.”
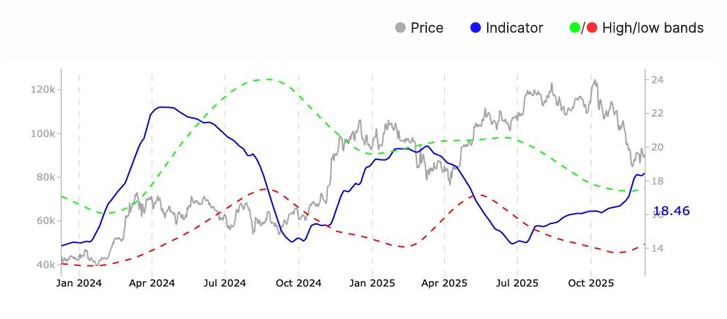
The supply ratio between short-term and long-term holders (STH/LTH), which measures how much of the supply is in the hands of short-term holders versus long-term holders, increased to 18.5%. This, showing that there is a greater relative weight of short-term participants, historically more sensitive to price. This is seen in the following graph:
Bitcoin profitability improves slightly
The percentage of bitcoin in profit increased to 67.3%. Although it implies progress, is still well below typical bull market levelswhich usually exceed 90%. Glassnode summarizes this situation by stating that “many coins remain underwater,” a characteristic feature of the initial stages of accumulation.
The Net Unrealized Gain/Loss indicator, which measures the difference between market value and realized value, improved from -16.3% to -14.6%, as seen in the following graph.
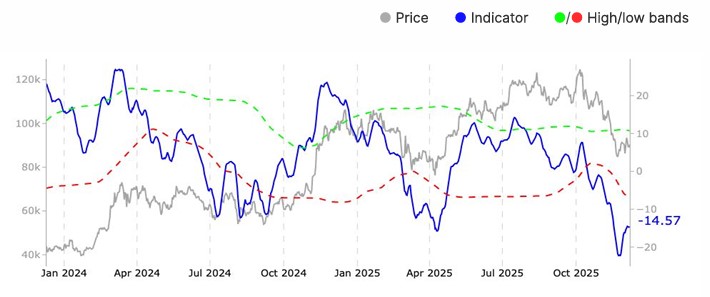
Although it is still in the negative zone, implies that the proportion of unrealized losses is reducing.
Finally, the ratio of realized profits and losses fell to -0.3. This means that, on average, more coins are moving in loss than in profit. According to the report, This behavior reflects a “cautious and partly capitulatory tone.”
The bitcoin market is recovering, but still fragile
Glassnode data allows us to draw a diagnosis consistent with the recent context: bitcoin has begun to show signs of stabilization and recovery. But it does so from a fragile foundationwith indicators that show prudence in both retail users and institutional actors.
The price rally, increased volume, and slight improvement in profitability metrics suggest that fresh bullish momentum is possible. However, persistent selling pressure, ETF outflows and the high presence of short-term participants confirm that the market continues in a reconstruction phasewhere confidence must be reaffirmed before sustained progress.