
There is weakened momentum and deteriorating market conditions, notes Glassnode.
“On-chain activity presents a heterogeneous panorama.”
Bitcoin (BTC) fell below $90,000 again, setting off alarm bells among investors.
According to Glassnode, an analysis firm, the price momentum has weakened, Market conditions have deteriorated and on-chain activity presents a mixed picturewhich keeps the asset “vulnerable to new falls.”
For company specialists, one of the indicators to take into account is the 14-period Relative Strength Index (RSI).
“Momentum weakened significantly as the 14-day RSI retreated into neutral territory, while spot market conditions deteriorated,” indicated the firm’s specialists. The chart shows bitcoin price momentum via the RSI:
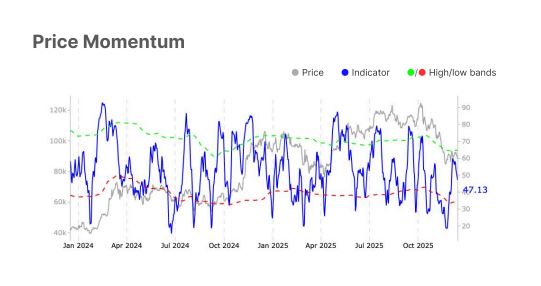
The gray line represents the price of bitcoin, the blue line corresponds to the RSI and the green and red bands indicate statistical levels associated with overbought and oversold areas.
Currently, the RSI stands near 47, below the neutral level (50), suggesting that the bullish momentum is weakening.
At the same time, the indicator is approaching the lower band, which points to increased selling pressure.
Fragility scenario for bitcoin
In practical terms, a capitulation is not confirmed, but a scenario of greater fragility is noted. Here probability wins a sideways consolidation or further correction before clear bullish continuity.
Likewise, the specialists indicated: “Spot CVD moved significantly into negative territory, indicating increasing sell-side aggressiveness, and spot volume continued to compress towards its lower statistical band, highlighting declining liquidity and lower conviction in price movements.”
At this point, it is worth clarifying that CVD is the accumulated delta volume indicator (Cumulative Volume Deltain English) in cash. This measures whether aggressive orders come mostly from buyers or sellers, as CriptoNoticias has explained.
According to the Glassnode report, sell orders are predominating over buy orders in the spot market.
At the same time, low trading volume reflects lower liquidity and conviction, making the bitcoin price more vulnerable to sharp movements.
The following graph shows the CVD of bitcoin, which measures the accumulated difference between aggressive purchases and sales in the market.
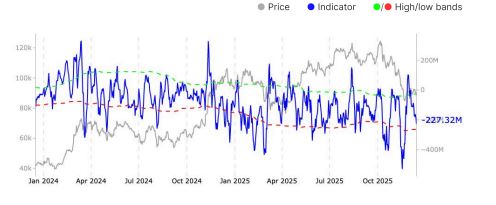
The gray line represents the price and the blue line the indicator. Himself deteriorated sharply to around -$227.3 millionapproaching the lower band. This suggests an increase in selling pressure and less buying conviction in the short term.
What happens to the activity of the Bitcoin network?
As mentioned above, Glassnode analysts warn that “onchain activity presents a mixed picture.”
“Active addresses decreased slightly, but the adjusted transfer volume per entity exceeded its upper band, indicating high capital movement. At the same time, pressure on fees decreased, indicating lower demand in the block space,” they explain.
In other words, although there are fewer active users on the network, large volumes of capital are being moved. However, the drop in commissions suggests that this activity does not translate into greater demand for transactions.
The following graph shows the metric of daily active addresses in the Bitcoin network. It should be noted that it is an on-chain indicator that measures the level of use and activity.
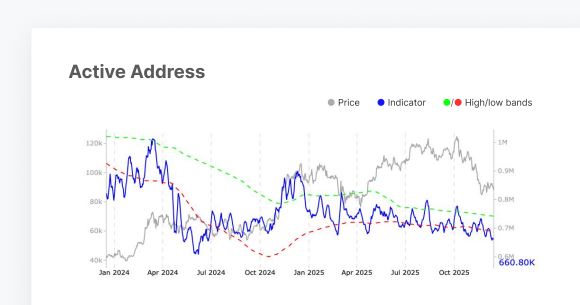
The gray line represents the price and the blue line the number of active addresses, which fell by about 2.3% to around 660,800, approaching the lower limit of the statistical range (green/red bands).
This suggests a slight slowdown in network activity, although still within normal levels and without signs of stress.
“Bitcoin ETF flows offset the situation”
Analysts add that it was recorded a strong rebound in net inflows into BTC exchange-traded funds (ETFs)despite declining trading volumes.
On the one hand, the weekly net flows of bitcoin ETFs took a sharp turn and went from outflows ($124.5 million) to inflows ($290.5 million). This suggests a return of institutional demand and a possible strategic accumulation via traditional channels.
This dynamic is constructive for the feeling, since reflects purchases with a longer horizon and not just short-term tactical movements.
However, the weekly trading volume fell from $19.8 billion to $17.6 billion. This is a sign of lower participation and a more cautious market, typical of consolidation phases.
In parallel, the MVRV of ETFs — an indicator that compares market value with realized value and allows estimating whether investors have unrealized gains or losses — fell from 1.65 to 1.59.
This indicates moderate profit compression, no signs of euphoria or capitulation. Furthermore, it reinforces the idea of a “cautious rather than euphoric” institutional positioning.
For this reason, specialists point out that the price drop from $94,000 has “reinforced a risk aversion regime driven by consolidation.”
“While some indicators point to underlying activity and institutional interest, conviction remains uneven, leaving the market vulnerable to further declines or prolonged trading within a fluctuating range until greater demand emerges,” they added.
Although there are specific signs of interest and institutional participation, There is still no solid and widespread demand to sustain a clear price recovery.