
The price of bitcoin (BTC) shows new bullish momentum after trading above $74,000 again this March 17, in a context of greater institutional demand.
This is explained by Glassnode, a firm specialized in metrics. on-chain and financial analysis, in its most recent report published on March 16, where it analyzes the current market structure and investor behavior.
According to the company, Current conditions present “mixed but constructive” signsindicating a progressive improvement, although still without clear confirmation of a sustained upward trend.
The main driving force of the movement is the activity of bitcoin exchange-traded funds (ETFs) cash in the United States.
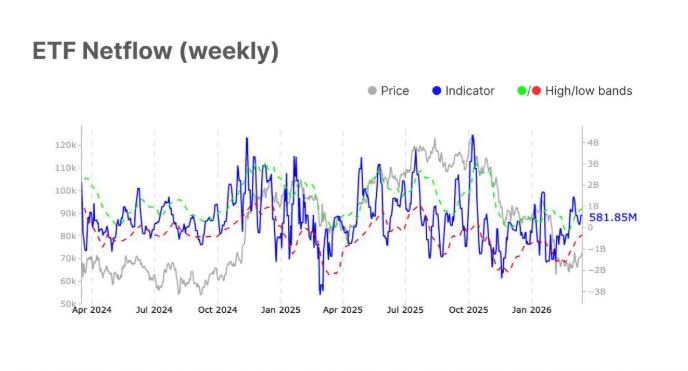
In the chart above, the blue line represents the net flow of capital into the ETFs, while the gray line shows the price of BTC. When the blue line turns positive, it means more money is coming in than going out, reflecting buying pressure.
The green and red bands, meanwhile, indicate the historical ranges of the indicator: the green zone indicates high levels of capital inflows (strong demand), while the red zone marks low levels or fund outflows. This allows contextualizing whether the current flow is at extreme levels or within a normal market range.
In this regard, Glassnode specialists point out: “Net inflows into spot ETFs reached $581.8 million in the last week (March 9-13), signaling strong institutional demand.”
This data is key because it indicates that the current momentum does not come only from retail investors, but from large institutional capital that accesses the market through these regulated products.
It should be noted that the good performance of these financial instruments has a direct impact on the price of BTC. When investors buy shares of these funds, the ETF issuers must purchase the underlying asset (in this case the digital currency) in the market to back those shares.
This mechanism generates real buying pressure, since it implies effective purchases of the asset and not just financial exposure. The greater the money inflows, the greater the direct demand on BTC, which tends to push its price up.
On the contrary, when capital outflows occur, funds may be forced to sell part of their holdings, generating downward pressure.
The volume drops, but the participation does not disappear
However, not everything is positive for ETFs. The weekly trading volume of these ETFs shows a drop to $17.7 billion, when it was above $40 billion in mid-February.
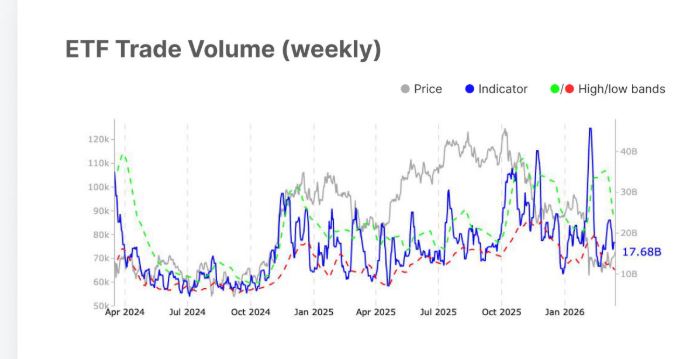
On the chart, the blue line represents the trading volume, while the gray line continues to show the price. The drop in volume indicates lower intensity in the activity.
“Volume remains comfortably above the lower bound, suggesting institutional participation is cooling at the margin, but not going away,” Glassnode analysts say.
This means that the interest is still present, although without the same level of aggressiveness as in stronger phases of the market.
The market enters profits, but without euphoria
The report also mentions what is happening with the MVRV indicator, which measures the relationship between the current market value and the value at which investors acquired their assets (in this case, shares of bitcoin ETFs). In simple terms, it indicates how much they are earning or losing on average.
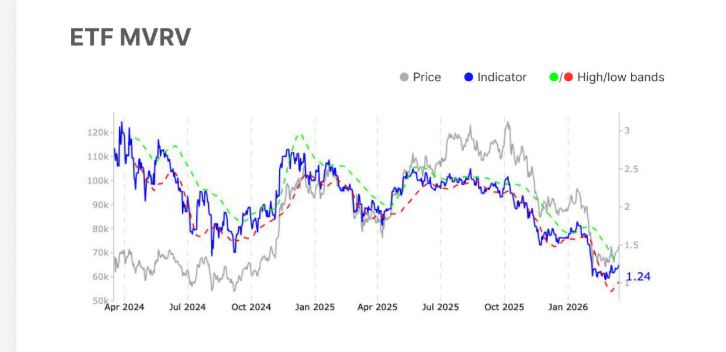
On the graph, the blue line reflects this ratio, and Its rise indicates that investors are accumulating profits. At the moment, the MVRV is located at 1.24, which implies a moderate level of profit. “The indicator remains within a normal range, pointing to an improvement in positioning without significant profit-taking pressure,” the report highlights.
When the MVRV is above 1, it means that the current price is above the average purchase price, meaning that investors, as a whole, are sitting on unrealized profits. The higher the value, the greater the incentive to take profits.
On the other hand, when the MVRV is below 1, it indicates that the price is below the average acquisition cost, which implies that a large part of the market is at a loss. Historically, these levels are usually associated with capitulation zones or bearish phases of the cycle.
This is important because in previous cycles, much higher values have anticipated massive sell-offs. In this case, the market still shows no signs of euphoria.
Activity on the Bitcoin network does not follow the movement
One of the weakest points of the report is the activity on the Bitcoin network. “Active addresses decreased below their lower limit, suggesting that on-chain activity has not yet confirmed the improvement in market sentiment,” they clarify.
To support their argument, they share a graph with the number of active addresses:
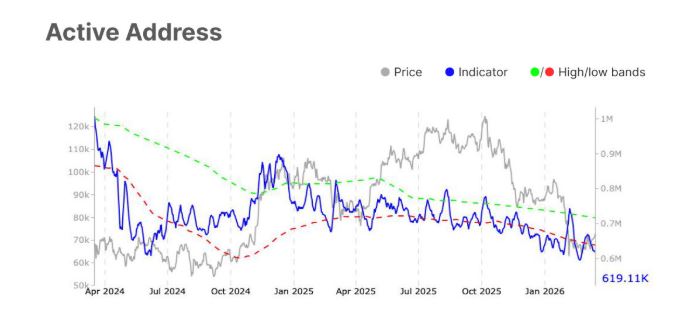
In this graph, the blue line represents the number of active addresses, that is, users who are transacting. The drop in this metric indicates lower network usage.
This is relevant because a strong bull market is usually accompanied by an increase in actual network usage. If the price rises without that activity, the movement may be more fragile.
Transfer volume measures the total value that moves within the Bitcoin network, that is, real economic activity.
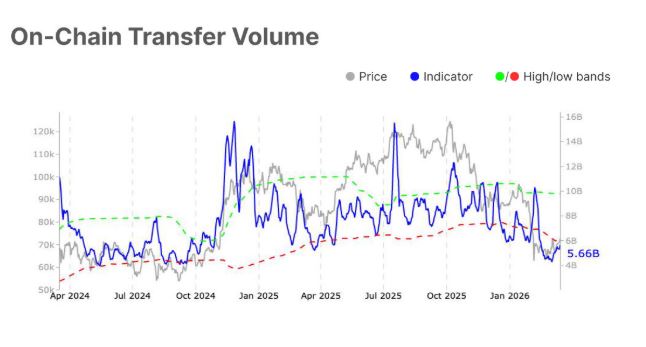
On the chart, the blue line shows this volume, which has seen a slight improvement, although it is still below the historical range (dotted red line).
“The volume of transfers increased modestly, but remains below typical levels, indicating that economic activity remains moderate,” the analysts explain. This reinforces the idea that the market is improving, but still without broad participation.
The report also analyzes the behavior of the derivatives market. “Derivatives markets reflect growing but cautious participation,” notes Glassnode.
Open interest in futures has increased, which implies an increase in the number of active unsettled contracts, signal of greater market exposure to derivatives. Futures contracts are financial instruments that allow traders to “bet” on the future price of an asset, such as bitcoin, without needing to own it directly, either by waiting for rises (long positions) or falls (short positions).
However, negative funding rates indicate that many traders are still positioned to the downside or hedging risks. This suggests that, Although there is more activity, there is no clear conviction in the continuity of the movement.
The risk of a “bull trap”
This mixed scenario opens the debate on the strength of the rebound. As CriptoNoticias has reported, Willy Woo, financial market analyst, warned that this upward price movement could be a “bullish trap.” That is, a rise that breaks resistance and attracts buyers, but lacks sufficient fundamentals to sustain itself.
This warning aligns with Glassnode data. Although there are strong institutional inflows, network activity remains low and the derivatives market is cautious.
Taken together, the report describes a market in transition. “Conditions show signs of stabilization and gradual recovery, but overall confidence has not yet been fully restored.”
For now, BTC’s momentum is sustained by institutional demand. However, without a clear recovery in network activity and with investors still cautious, the market has not yet confirmed a solid bullish phase.