
This decoupling is being detrimental to bitcoin, which has been falling for months.
The S&P 500 remains relatively strong near its all-time high.
Bitcoin (BTC) is currently experiencing its longest period of divergence from the S&P 500 Index in the last six years. While the main stock market indicator of the US economy maintains relative strength near its highs, bitcoin has deepened a corrective cycle that moves it away from its historical peak reached last October.
This breaks with the correlation trend observed since the start of the COVID-19 global health crisis in January 2020, an event that marked the last period of decorrelation.
The current behavior of the digital currency has transformed the price structure of the asset. Its price is around $71,812 on the current day, Monday, March 23, 2026, which represents a 43% drop from its all-time high of $126,000, recorded on October 6.
In contrast, the stock market has not shown capitulation of the same magnitude; The S&P 500 closed on Friday, March 20, 2026 at 6,472 points, representing a slight decline of 7.5% compared to its highest point of the year of 7,000 points reached on January 28.
Typically correlated with the S&P 500, bitcoin has instead “moved in the opposite direction for several months, marking its longest period of decoupling from stocks since 2020,” explains the analyst which is identified as “Darkfost”, from the CryptoQuant data platform.
This parting of ways became more acute after a mass liquidation event at the end of last year. “For reference, on October 10 the market saw approximately 70,000 BTC removed from open interest, taking it back to levels not seen since April 2025,” the researcher details. That day was decisive, since in just 24 hours the market suffered a wave of liquidations exceeding $19 billion, which accelerated selling pressureas reported by CriptoNoticias.
The graph below confirms the decoupling with the red stripe at the end of the timeline. While the purple line (S&P 500) remains at high levels or even rises slightly, the black line (bitcoin) shows a sharp decline. The blue area in this zone drops below zero, confirming that bitcoin has stopped keeping pace with the traditional stock market.
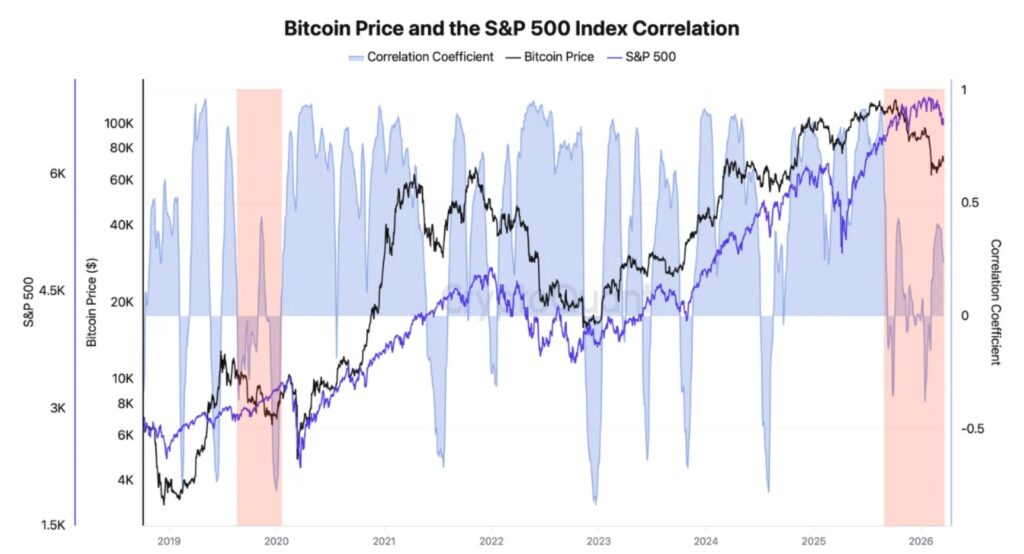
The image shows another red band in early 2020. That was the last major period of significant decoupling.
Regarding the current difference in the behavior of bitcoin and the S&P 500, Darkfost comments: “This divergence highlights how much the digital currency market has already suffered, long before the S&P 500 recently began to correct.” The specialist adds an observation about the nature of bitcoin in the face of global crises: “it must be recognized that bitcoin remains less resilient and more volatile, which makes it more reactive to these types of events.”
Who will follow who?
The current scenario makes it clear that the relationship between the traditional technology sector and digital currency is not an immutable constant. Historical data reflects that this is the most significant distancing since that last great period of decoupling recorded six years ago.
This proves that this correlation is not permanent and can be broken abruptly in the event of a liquidity crisis or specific events that affect the markets.
Going forward, it remains to be determined whether the S&P 500 will finally follow in the footsteps of bitcoin in a deeper correction or if, on the contrary, the digital currency will manage to recover lost ground to rejoin the general market trend.