
“Whale activity on LINK is intensifying,” says Darkfost.
In 2026, 2 peaks of daily departures of more than 8,000 LINK were observed.
Chainlink (LINK) outflows from Binance, the largest bitcoin (BTC) and cryptocurrency exchange, are showing a sustained increase from February to March 31, 2026. This is a movement that can be interpreted as a possible sign of accumulation in personal wallets by large investors.
According to analyst Darkfost, from the on-chain analysis firm CryptoQuant, “whale activity on LINK is intensifying.” To closely follow this dynamic, the specialist analyzes the largest transactionsin particular the top 10 daily chainlink outflows from Binance.
The idea is that these movements work like an approach to the behavior of whalesthose entities that own more than 1,000 units of the asset.
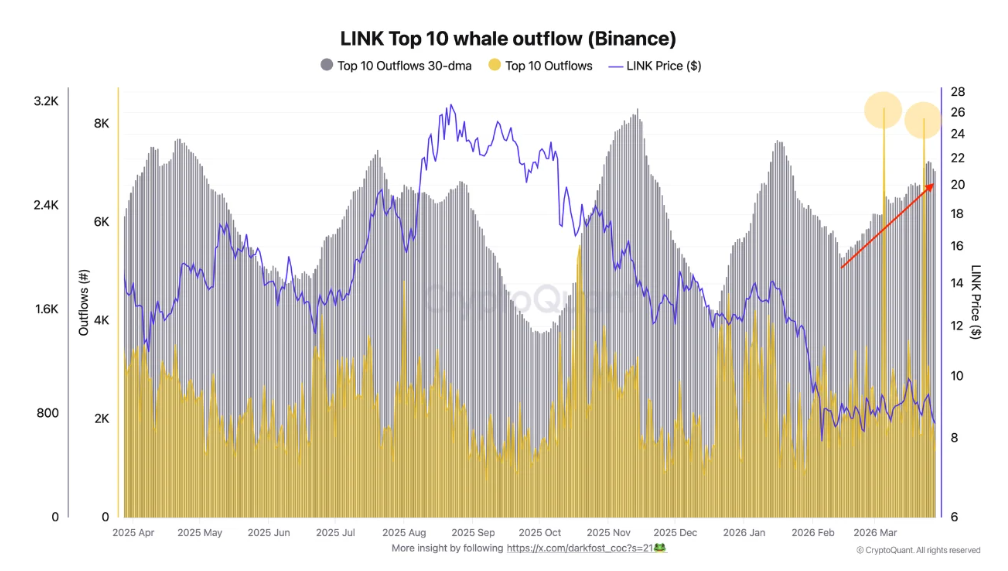
In the graph above, the gray bars represent the total volume of LINK outflows from Binance in the top 10 transactions each day, calculated as a 30-day moving average. This allows the underlying trend of whale activity to be observed.
The yellow bars show the specific daily withdrawals within that top 10, that is, the specific peaks of largest withdrawals. Lastly, the blue line indicates the price of LINK in dollars over time.
What is observed is a progressive increase in departures. While in previous months the average was close to 2,000 LINKs per day, Since mid-February, that level has risen to approach 2,600 LINK per day.
Additionally, the chart highlights two peaks in 2026 (yellow circles), where outflows exceeded 8,000 LINK in a single day within the largest transactions, suggesting large-scale movements by whales.
In terms of analysis on-chainthese types of movements are usually interpreted as a potentially bullish signal. When large amounts of an asset leave an exchange, it generally means they are being moved to external wallets, which can reduce immediate selling pressure.
As Darkfost explains, “monitoring exchange outputs and associated amounts allows us to identify possible accumulation phases.” In this case, the increase in withdrawals could indicate that certain actors are increasing their exposure to LINK with a medium or long-term vision.
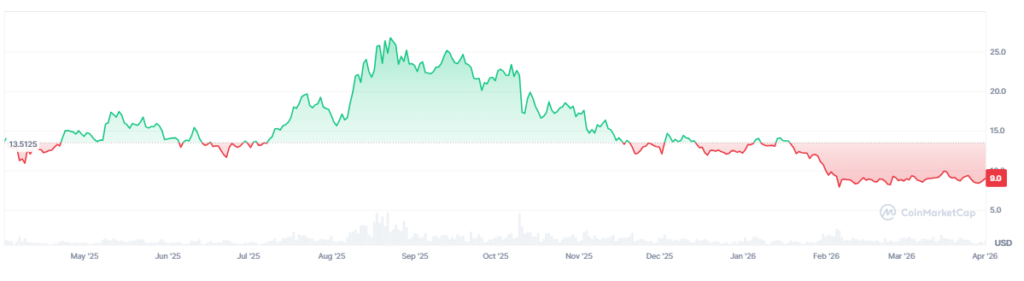
However, the analysis itself introduces an important nuance. These patterns do not guarantee a trend change. Proof of this is that the price of LINK has accumulated a drop of 36% in the last 12 months.
Therefore, the context continues to be decisive. The war in Iran and the decision of the United States Federal Reserve (FED) to keep rates unchanged continue to weigh on the market. Although bitcoin (BTC) managed to recover and exceeded $68,000 again, still remains below 70,000 dollars, as reported by CriptoNoticias.
In this scenario, the increase in LINK outflows from Binance appears as relevant, but not definitive, data. It may indicate growing interest from big players, although it is still not enough to confirm a structural change in the asset’s trend.
As the analyst concludes, these flows “continue to be a signal worth monitoring,” since their evolution could offer clearer clues in the coming weeks about the positioning of the whales in the market.