
After this fall, bitcoin would go towards the levels predicted by the PlanB model.
After this fall, bitcoin would go towards the levels predicted by the PlanB model.
PlanB, recognized market analyst for its predictive model Stock-to-Flow (S2F), warned on April 1, 2026, that the price of bitcoin (BTC) could fall below $59,000 before resuming an upward trend.
“As I’ve already said, I wouldn’t be surprised if BTC fell below the 200-week moving average ($59,000) and realized price ($54,000) before the next rally,” he said in a statement. publication of X
Even so, it maintains its long-term projection: levels close to 500,000 dollars, within a range that goes from 250,000 to 1 million of dollars
To support its thesis, PlanB shares a bitcoin price chart that combines several indicators:
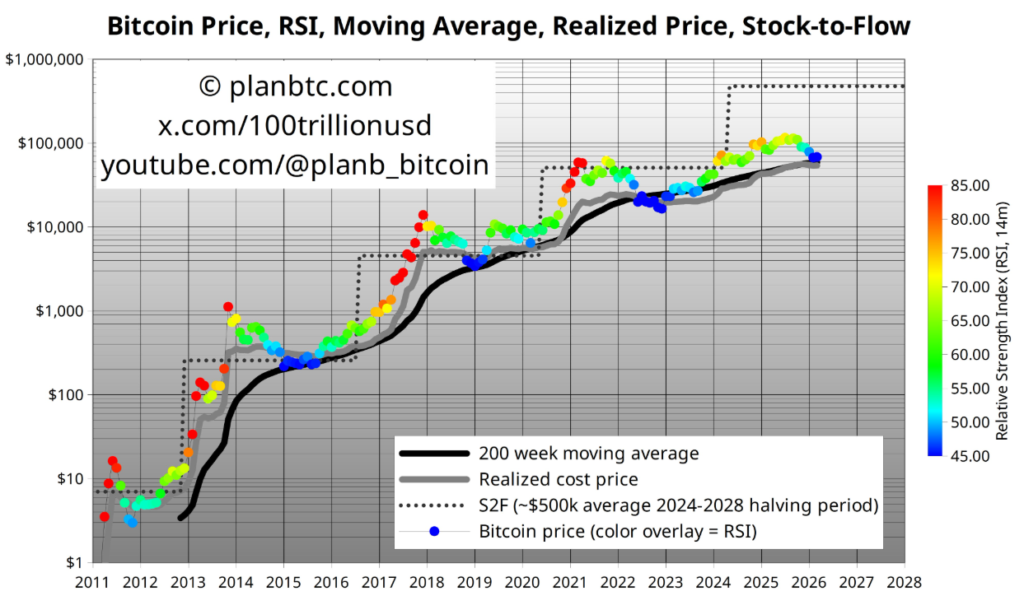
First of all, the black line represents the 200-week moving average, one of the most relevant support levels in BTC history. This is the average of the value in the last almost four years and, in previous cycles, it has functioned as a floor during bearish phases, as in 2022 after the fall from the all-time highs of 2021.
Above that reference a gray line appears, which corresponds to the realized price of the coin created by Satoshi Nakamoto. This indicator reflects the average value at which the BTC currently in circulation were acquired and is usually interpreted as the “base cost” of the market.
In turn, the price of BTC is represented by points whose color is not random. Each of them incorporates the relative strength index (RSI) an indicator that measures market strength on a scale of 0 to 100.
Red and orange tones indicate overbought areas, green reflects a more neutral state and blue indicates like the current one (RSI 44), suggest relative price weakness.
Additionally, there is a dashed line that represents the expected trajectory according to the S2F model. As seen, For the current cycle the average projected price is around $500,000a level that supports PlanB’s long-term bullish vision.
What is the Stock-to-Flow model?
The S2F model attempts to explain the price of bitcoin from its scarcitybut the idea is simpler than it seems.
It works by comparing how much BTC already exists (stock) with how much is created each year (flow). If few new units are issued relative to what is already there, the asset becomes scarcer.
That is, if there is a lot of something and a lot of it continues to be produced, it is not scarce. But if there is a limited quantity and almost no more is produced, its value tends to rise. In the case of BTC, its issuance is reduced every four years with the halving, which means that fewer and fewer new coins enter the market. That increases its scarcity over time.
Under this model, BTC has an index close to 113, more than double that of gold (around 60), which would imply that it is more scarce. The logic is direct: If something is scarcer, it should be worth more.
For years, this approach worked quite well to follow the price trend. But today it is under discussion, because the market seems to respond more and more to factors such as global liquidity, interest rates or geopolitical conflicts, and not only to scarcity.
The debate intensified after an analysis published on March 27, 2026 by Tommaso Scarpellini, an investment specialist, who maintains that the mathematical models that for years explained the price of BTC “are failing miserably,” as reported by CriptoNoticias.
According to his thesis, scarcity, the main bullish argument, is no longer governing price behavior as in previous cycles. While the Stock-to-Flow model described the trend well through 2022, today shows a growing disconnection with the current market dynamics.
In fact, Scarpellini warns that This type of models has lost prominence within the communityas other factors begin to weigh more.
Context: macroeconomics and geopolitics determine the price
PlanB’s analysis and criticism of its model occur in a context where bitcoin is increasingly influenced by external variables.
Tensions in the Middle East, especially around the Strait of Hormuz, impact the price of oil and, by extension, global inflation. Added to this is the decision of the Federal Reserve (FED) to maintain interest rates at 3.75%which restricts the liquidity available for risky assets.
Furthermore, the fragility of private credit adds pressure to the financial system, generating a more adverse environment for the markets.
In this scenario, BTC managed to recover towards the $68,000 area, but the market still does not find a clear direction.
PlanB’s approach exposes an increasingly evident tension: the coexistence between long-term theoretical models and a market that responds, in the short term, to macroeconomic and geopolitical factors.
It is for this reason that, for the analyst, a fall towards $59,000 would not be an anomaly, but part of the normal behavior of the cycle before a new bullish impulse.