
When bitcoin approaches USD 70,000, short-term investors sell massively.
Yesterday, April 5, 2026, almost 15,000 bitcoin in profit were sent to exchanges.
Darkfost, a financial markets analyst, warned that profit-taking in bitcoin (BTC) is accelerating every time the price approaches $70,000 again, an area that, for now, continues to function as resistance for the market.
“Beware, profit taking by short-term holders is accelerating as BTC retests the $70,000 level,” wrote on April 6, 2026 in your X account.
He then added: “This is a key resistance that continues to hold back BTC. Every time the price has approached this level, short-term holders have intensified profit taking. Today, approximately 14,900 BTC in profits were sent to exchanges, increasing short-term selling pressure.”
His reading suggests that the problem is not only in the lack of buying power, but also in the fact that Many recent market participants are taking advantage of this area to sell at a profit.
To explain this dynamic, the analyst shared a graph from the CryptoQuant platform, which shows the volume of bitcoin sent to exchanges by short-term investors (Short-Term Holders). That is, those investors who acquired the asset less than 155 days ago.
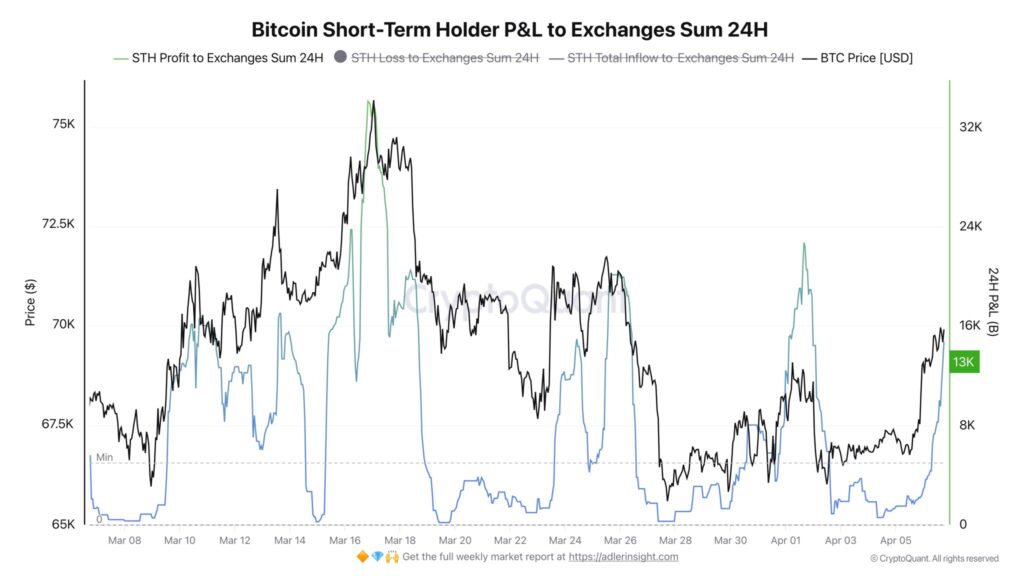
As seen, the black line represents the price of bitcoin in dollars, while the blue line shows the amount of BTC sent to exchanges with profits by short-term holders during the last 24 hours.
In other words, that blue curve reflects how many BTC are being moved to exchange platforms by recent investors who are profiting. Since these movements usually anticipate sales, the indicator works as a signal of selling pressure.
What is observed is that, every time the price approaches the $70,000 area, Profitable BTC shipments to exchanges increase strongly.
This happened several times during March and was repeated on April 5, when that figure approached 15,000 BTC.
The reading is clear: many short-term investors They are using that level as an opportunity to exit the market with profits, which increases the available supply and makes it difficult for the price to break upwards.
This behavior helps explain why BTC continues to crash into that area without managing to consolidate above it. It is not enough that there are buyers: it is also necessary to absorb a growing volume of sales. And, according to Darkfost, That selling flow is intensifying just when BTC is approaching that resistance again.
As explained in Criptopedia, educational section of CriptoNoticias, in technical analysis, resistance is a level where the price usually slows down due to the appearance of sales, while support is an area where it tends to find demand that prevents deeper falls.
“A negative zone” for bitcoin
Glassnode, an on-chain analytics firm, also shares Darkfost’s thesis. Today, April 7, its analysts indicated that “BTC is trading within a tight negative gamma zone near $65,000-$70,000, where trader hedging can amplify short-term moves.”
The chart shows the derivatives market. This is a historical exposure map on Deribit, a cryptocurrency exchange specialized in derivatives.
Gamma exposure measures how large traders in the options market react to price movements. In negative gamma areas, like the current one, These hedges tend to amplify movements, increasing volatility.
In the chart above, the black line again represents the price of BTC, while the colored stripes show areas of concentration of gamma exposure in the options market.
Areas in green reflect positive gamma exposure, which tends to stabilize the price, while areas in red indicate negative gamma exposure, a context in which operator coverage can amplify market movements.
In that chart you see that BTC is trading within a tight negative gamma zone, approximately between $65,000 and $70,000. That means short-term moves can become sharper, both up and down, because hedging of positions by options market participants tends to reinforce the direction of the move rather than dampen it.
At the same time, Resistance begins to form near $72,000, while support looks weaker below.
The consequence is that the advance of BTC encounters a double obstacle. Not only does it have to overcome technical resistance, but also absorb increasing profit taking by recent investors. Until that happens, the $70,000 to $72,000 area will continue to be the point where bullish momentum is tested.