
Although the analysis does not mention bitcoin, the correlation with traditional assets could affect it.
Currently, the S&P500 is trading near all-time highs.
Charles Edwards, founder and CEO of the investment firm Capriole Investments, warned that every time inflation in the United States reached levels similar to current levels, the stock market ended up registering sharp falls during the following months.
The analysis was published on May 20, 2026 and is based on the historical performance of the S&P 500 index compared to periods of high inflation measured through the CPI (Consumer Price Index) and the PPI (Producer Price Index) of the United States.
These are two of the main indicators that the Federal Reserve (FED) looks closely at when deciding whether to maintain, raise or reduce interest rates.
“Every time inflation crossed levels as high as today, the market fell 30% on average over the next 1 to 24 months,” wrote Edwards on X.
According to the executive, The biggest stock market crashes in recent decades occurred precisely in environments of high inflation. “All the great crashes occurred in this context (47% in 2000 and 55% in 2008),” he noted.
To support his thesis, he shared a graph with the historical evolution of the S&P 500 from the late 1960s to the present.
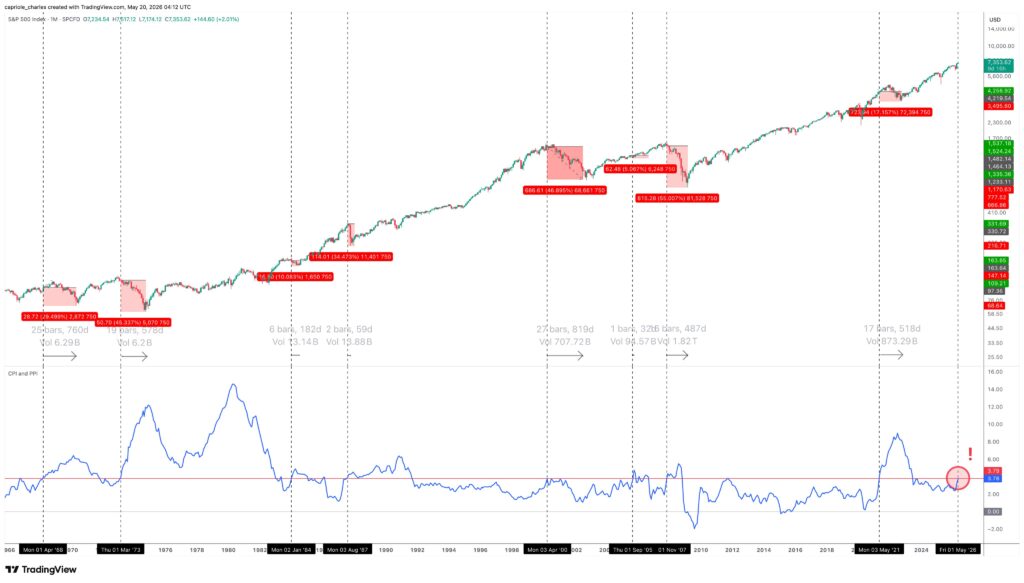
As seen in the previous image, the red areas mark important market corrections and They quantify the percentage of decline registered in each period.
At the bottom a blue line appears corresponding to US inflation indicators. The horizontal red line works as a reference threshold: according to Edwards, every time inflation exceeded that zone, relevant corrections subsequently appeared in the financial markets.
Currently, the S&P 500 continues to trade near historical highs while inflation once again approached that critical level indicated by the analyst.
The analysis becomes relevant because the latest inflation data in the United States had already raised alerts in the market. As CriptoNoticias reported, the CPI for April stood at 3.8% year-on-year, above the expected 3.7%, while core inflation (excludes food and energy due to its greater volatility) reached 2.8%, also above the expected 2.7%.
Although Edwards does not directly mention bitcoin (BTC), the analysis also generates attention within the digital asset market due to the growing correlation between BTC and US stock indices in adverse macroeconomic contexts.
If stocks were to face a sharp correction, BTC could be hit by greater risk aversion, reduced liquidity and capital outflow from volatile assets.
However, the publication also raised questions. A user identified as GeekopediaX pointed out that the chart could be partially selecting certain historical periods.
“The CPI exceeded 3.8% in 2021 and the market continued to rise to new highs,” he wrote. He also highlighted that during the ’90s inflation remained between 3% and 4% while stocks went through one of the best bullish periods in their history. Furthermore, he questioned that the 2022 fall (marked on the graph itself with a decline of close to 17%) can hardly be considered a “systemic collapse.”
“Stocks fall 10% to 20% every two years on average. If you give any indicator a 24-month moving horizon, you will always find a drop,” he argued.
Edwards responded by defending his methodology and clarified that The goal of the analysis was not necessarily to anticipate a systemic event, but rather to show a historical statistical relationship. “It just seems that the maximum drawdowns They are within two years of such high inflation. All occurrences in the last 60 years,” he answered.
It should be explained that, in financial markets, drawdown refers to a cumulative decline from a high to a subsequent low. It is a metric used to measure how much an asset or index lost during a correction or bear market before recovering.
The debate appears at a particularly sensitive time for financial markets. CriptoNoticias has reported that The partial blockage of the Strait of Hormuz continues to put upward pressure on international oil pricesraising global inflationary risks and reducing the chances of rate cuts by the FED.
This context usually negatively affects assets considered risky, such as technology stocks and BTC, due to the lower liquidity available in the financial system.