
At $60,000 (lowest price of 2026, so far) BTC would find strong support.
According to Willy Woo, a typical bear market would take bitcoin to $45,000.
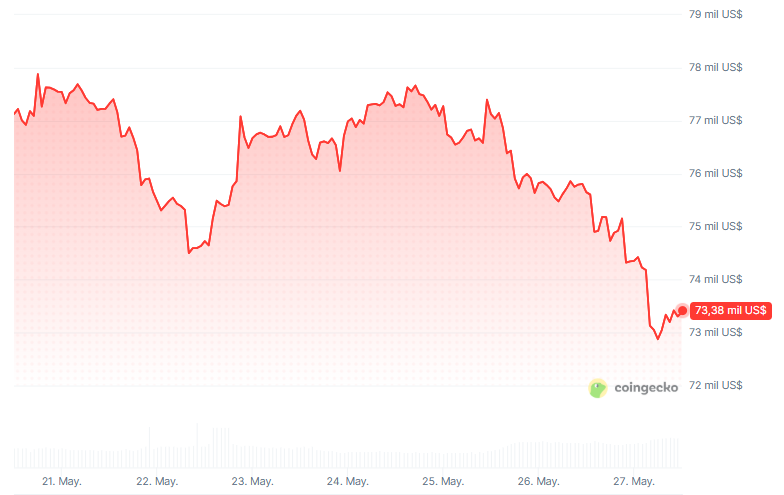
The price of bitcoin (BTC) was below $73,000 on the morning of this Thursday, May 28, 2026, although it made a rapid recovery towards that price area.
At the time of this publication, the CriptoNoticias Price Calculator shows that each bitcoin trades for $73,380 on the main exchanges.
In the last 7 days, the digital currency had a drop of close to 7% and this revives fears of further price corrections.
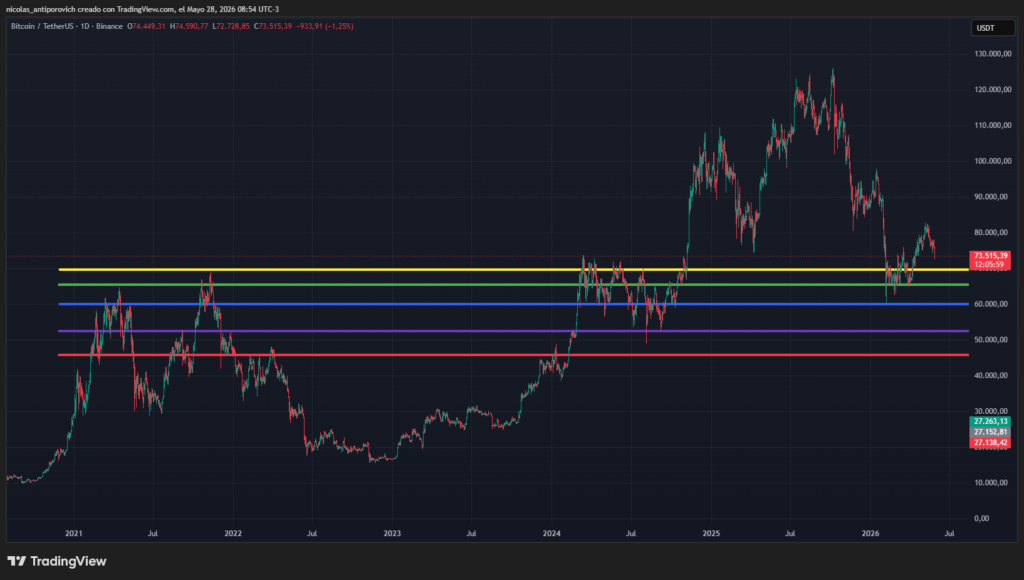
How far could bitcoin fall if the downtrend continued? Although it is impossible to make a 100% accurate prediction, the theory of supports and resistances allows us to make estimates based on the history of the asset. This theory says that levels that have once functioned as supports or resistances tend to repeat themselves in the future.
Taking that into account, it can be seen that The next important level for bitcoin would probably be in the area around $70,000. (yellow line in the graph that accompanies this publication). Approximately that was the all-time high reached by bitcoin in 2021. In addition, bitcoin has bounced several times in that area during 2024 and early 2026.
In case bitcoin were to also lose the $70,000 level, Next support could be found around $65,000 (green horizontal line). In October 2021, the digital currency marked a first all-time high near that price zone. It was also a level that served as resistance in September 2024 and as support on several occasions during February and March of the current year.
Subsequently, one of the strongest support and resistance zones at the historical level is near $60,000 (blue line). The price chart shows that bitcoin has bounced (both up and down) 7 times near that price. The most recent was in February 2026. That is the lowest price bitcoin has reached this year… for now.
In case bitcoin felt like going for lower prices, it would find support —based on the historical rebound and lateralization zones— between 45,000 and 50,000 dollars (red and purple lines, respectively). According to many analysts including, for example, Willy Woo, that would be a “typical bear market low” for bitcoin.
The next price movements of bitcoin are likely to be largely related to news about the war in Iran.
This war has kept the Strait of Hormuz (a key maritime passage for the global oil industry) blocked since February 28, which is causing an incipient global inflation crisis. In this context, the US Federal Reserve (FED) and other central banks have low incentives to cut interest rates and that hurts bitcoin and cryptocurrencies.
This May 28, the Reuters agency report that “The United States and Iran trade attacks as hopes for a Strait of Hormuz deal fade.” As can be seen, The war in Iran appears to be far from over.
But, taking into account that price projections are not infallible and that any positive development could change the market mood, having prudent investment strategies with good risk management is essential. Dollar-cost-averaging (DCA), for example, can be useful for those who have a bullish view on bitcoin in the long term and want to accumulate as many sats as possible without worrying about guessing what the market bottom will be.