
The recent fall in the price of bitcoin (BTC) below the psychological barrier of $60,000 set off traditional alarms in the digital asset market, unleashing a wave of bearish forecasts that evokes the ghosts of past crises. However, far from a blind collapse, the main crypto asset seems to be seeking technical support long anticipated by financial analysis algorithms.
To understand where this correction could stop, which already has a loss of more than 50% from its last historical maximum, specialized firms such as Glassnode They scan the behavior of long-term investors.
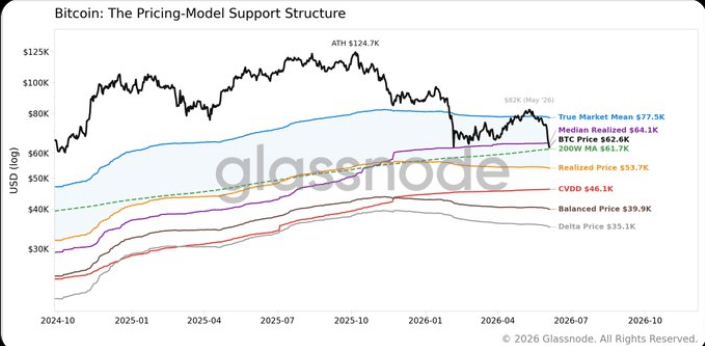
Using a metric known as the Realized Price, which calculates the average value at which coins were last purchased on the blockchain, analysts place a critical containment zone around $54,000. It is the digital equivalent of the cost of production in the economy. That is, a threshold where historical buyers usually refuse to sell at a loss.
The threshold where panic over the price of bitcoin stops
If that first line of defense gives way, the mathematical model activates a second historical buffer near $46,200, based on the accumulated value of the destroyed holding days.
This combination of indicators delimits a high probability zone for a structural bottom. “The high probability bottom zone is between $46,000 and $54,000,” says Rafaelco-founder of Glassnode, alluding to a geographic price space where historically retail panic is absorbed by the accumulation of large treasuries.
The great paradox of this cycle is that, despite the current nervousness, the hard data reflects unprecedented resistance. While in previous bear markets bitcoin suffered dramatic contractions of between 77% and 85%the current retreat is visibly more superficial. Although, given the price level reached, the drop looks much worse when measured in dollars: from the ATH of $126,000, the drop has been more than $65,000.
Some analysts agree that historical levels of These indicators have acted as floors in previous cycles and that he drawdown Current shallower points to a likely bottom at the top of the range. Others warn that in environments of macro liquidity crisis or strong capitulation, the price can pierce these supports towards lower levels.
The models provide price ranges, not time frames, and the lows typically include rapid downward moves. The debate pits on-chain analysis against broader macroeconomic conditions.
Bitcoin currently operates near its 200-week moving average, a level that in previous cycles has functioned as a support zone during deep corrections, along with the median realized price, as reported by CriptoNoticias.
In any case, the market is entering a phase of technical wear and tear where the data models have already done their job by defining the risk maps, but the temporal variable remains open.
Attention now shifts to investor patience. This is because this floor for the price of bitcoin will probably not depend on mathematical formulas, but on the speed with which long-term buyers decide to validate these prices against a traditional economic environment that continues to put pressure from the outside.