
XWIN Research believes that investors are entering a period of patience and accumulation.
“Extreme fear” grips the bitcoin market, which has preceded rebounds, Santiment says.
The price of bitcoin (BTC) is located today, June 8, 2026, above $63,000 amid mixed signals that divide traders and investors. The sector evaluates whether the price represents a consolidated rise or if it is a bullish trap, a false signal where the price rises briefly and then continues its downward trend.
The following chart, provided by CoinGecko, shows how the price of bitcoin has moved over the last month:
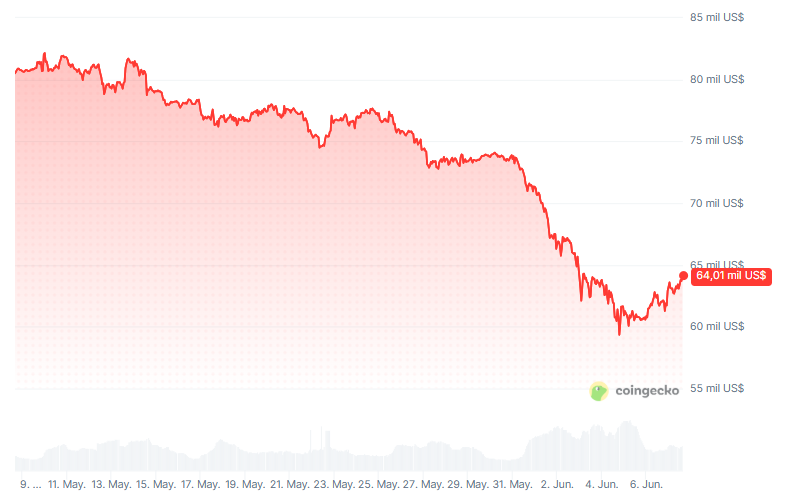
The fall of bitcoin at the end of May and beginning of June was due to an increase in war tensions in the Middle East, capital outflows from bitcoin ETFs and the announcement that Strategy (the publicly traded company with the most bitcoin in its treasury) sold 32 bitcoin.
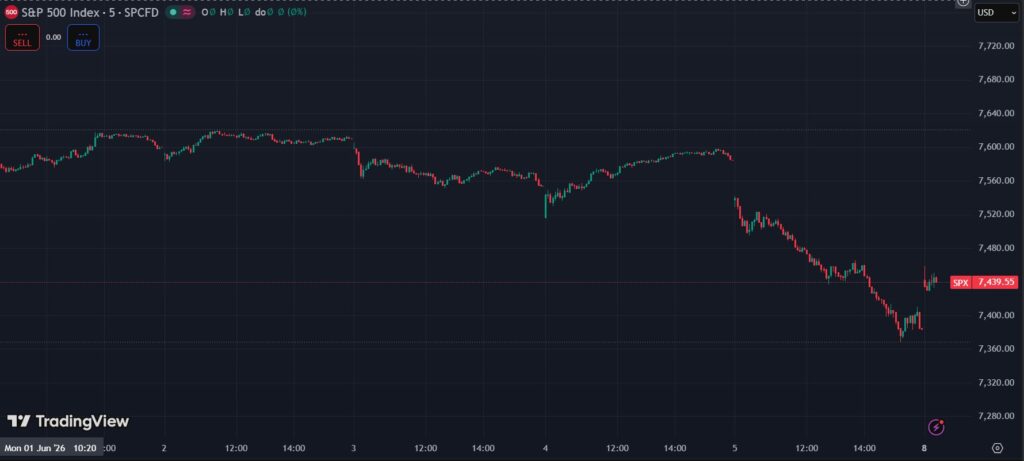
In addition, uncertainty grew after the stock market crash last Friday. This fall in traditional stock markets generated a climate of global risk aversion that directly affected the performance of bitcoin.
In the traditional sphere, the S&P 500 index, which brings together the five hundred most important companies in the United States, fell to 7,369 points from a previous maximum of 7,599 points. This decline represented a 3% drop and had a negative impact on operators’ expectations..
It is crucial for bitcoin to surpass $65,000, says Michaël van de Poppe
Analyst Michaël van de Poppe had pointed out yesterday that “I would expect to see prices fall slightly further before today’s open Monday, as stock markets plummeted Friday night.” However, the specialist also predicted a change in trend soon.
“After the markets open in the United States, or on Tuesday, this will reverse upwards and we will start to see a glimmer of bullish momentum in bitcoin,” van de Poppe said. According to his vision, the behavior of traditional stock indices will be decisive.
“It is very likely that the price will not cascade today if the indices turn green, yields fall and STRC does not continue to unpin,” the specialist explained. STRC refers to the convertible debt financial instrument issued by the Strategy company to acquire more units of bitcoin.
“Even better: If Michael Saylor has been buying, the whole thesis goes out the window,” the analyst noted. Confirmation of the purchase by Strategy, given today, June 8, 2026, weakens the theory of a prolonged crashaccording to this technical market approach.
“Regardless of that, the crucial level to break is the $64,000-$65,000 area,” van de Poppe detailed. Overcoming this psychological resistance would open the doors to a completely different scenario for the price of this bitcoin, as seen in the graph below:
“If that breaks, nothing is stopping bitcoin from running all the way to $71,500-$73,000 and potentially even as high as the CME gap at $79,000,” the trader projected. The CME gap is a price gap in regulated futures contracts.
For these reasons, according to van de Poppe, the current outlook is attractive for long-term traders. “It is an ideal area to accumulate positions,” commented the trader regarding the prices recorded in recent days.
ETF funds slow institutional advance
In contrast, data on bitcoin exchange-traded funds (ETFs) in the United States show a restrictive scenario. The researcher CryptoVizArt alerted that the 30-day simple moving average (30D-SMA) of ETF net flows fell to -2,450 BTC per day. This metric calculates the average daily capital outflows over the last month.
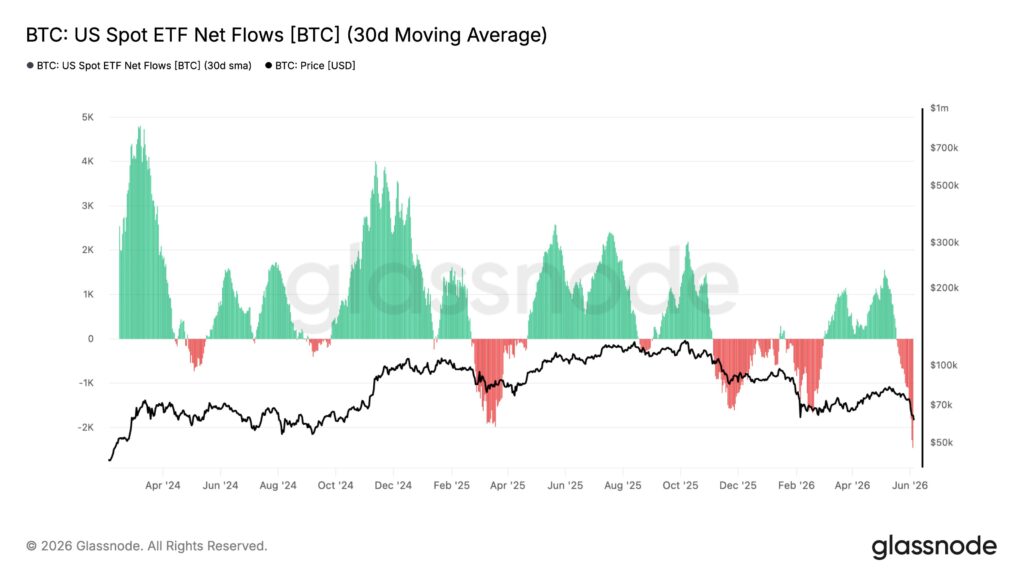
This figure represents the fastest sustained pace of money outflows since the launch of these financial products. The continuous negative flow exerts constant selling pressure that prevents price stabilization.
«This is no longer a short-term reaction. “A one-month average in record negative territory reflects a structural change in institutional positioning, not episodic sales,” CryptoVizArt argued in its technical analysis.
The lack of interest from large funds mitigates the optimism of the retail market. “Until this softening trend reverses, the demand side from ETFs remains a headwind rather than support,” he concluded.
In line with this institutional brake, the analysis firm Santiment detected that general sentiment fell to 2026 lows. This metric evaluates the collective psychological and emotional state of market participants—measuring whether optimism or fear predominates through behavior and opinions on social networks. Under this panorama of pessimism, Retail operators began to declare on digital platforms that the crypto asset is “dead”.
However, the consulting firm clarified that extreme fear, the decoupling of the stock market and the reversal of financing rates “have historically preceded large rebounds” in the bitcoin market.
«Speculative excess has been eliminated»
At the same time, the Japanese investment firm XWIN Research detected that “speculative excess has largely been eliminated from the system. “Market sentiment has shifted from euphoria to caution, and investors are entering a period of patience and accumulation.”
The company recalled that bitcoin is trading near its 200-week moving average and its realized price. The realized price calculates the average cost at which all coins were last moved.
«This does not guarantee that the fund [de precio] is already established. However, it suggests that bitcoin is not experiencing a structural failure. Instead, it is experiencing a lack of demand while competing with some of the strongest investment narratives,” the company’s analysts qualified.
For Willy Woo bitcoin is “in the process of recovery”
For his part, the analyst and trader Willy Woo observed that the volume weighted average price (VWAP) peaked. This metric balances the price with the total trading activity of the asset. From there, Woo interpreted that this fall “has spread too far and [el precio de bitcoin] “He is in the process of recovery.” Furthermore, the SOPR indicator, which measures the profit ratio of coins spent, supports this view.
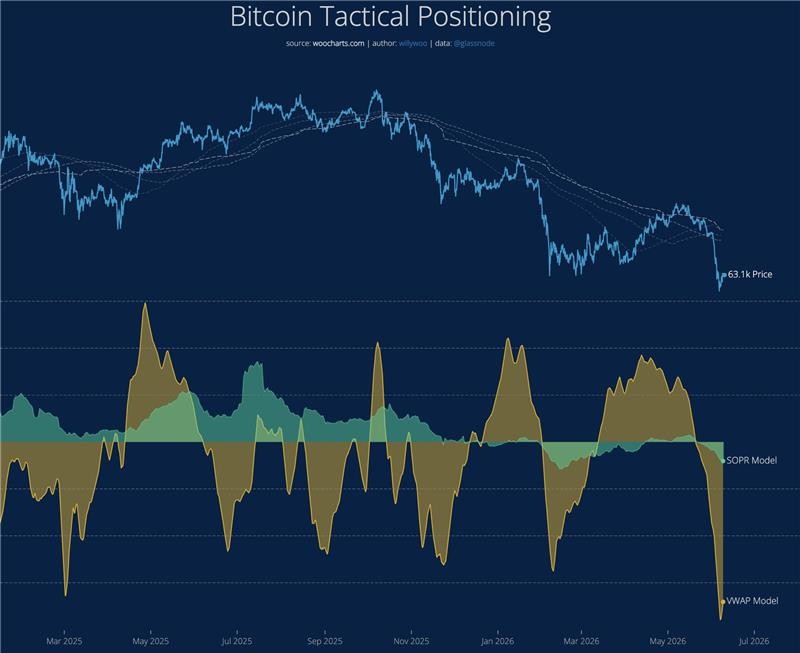
The SOPR suggests that digital currencies selling at a loss also “could have reached their peak or be very close to it.” This marks a possible exhaustion of sellers in the short term..
Although the flow model shows capital outflows at an increasing rate, Woo sees a near change. If flows bottom out in the coming weeks, “a bullish divergence could form,” he said. The yellow area that had been timidly forming between April and May 2026 has disappeared. The flow has crossed into negative territory (orange/red), confirming that more money is currently leaving the ecosystem than is entering.
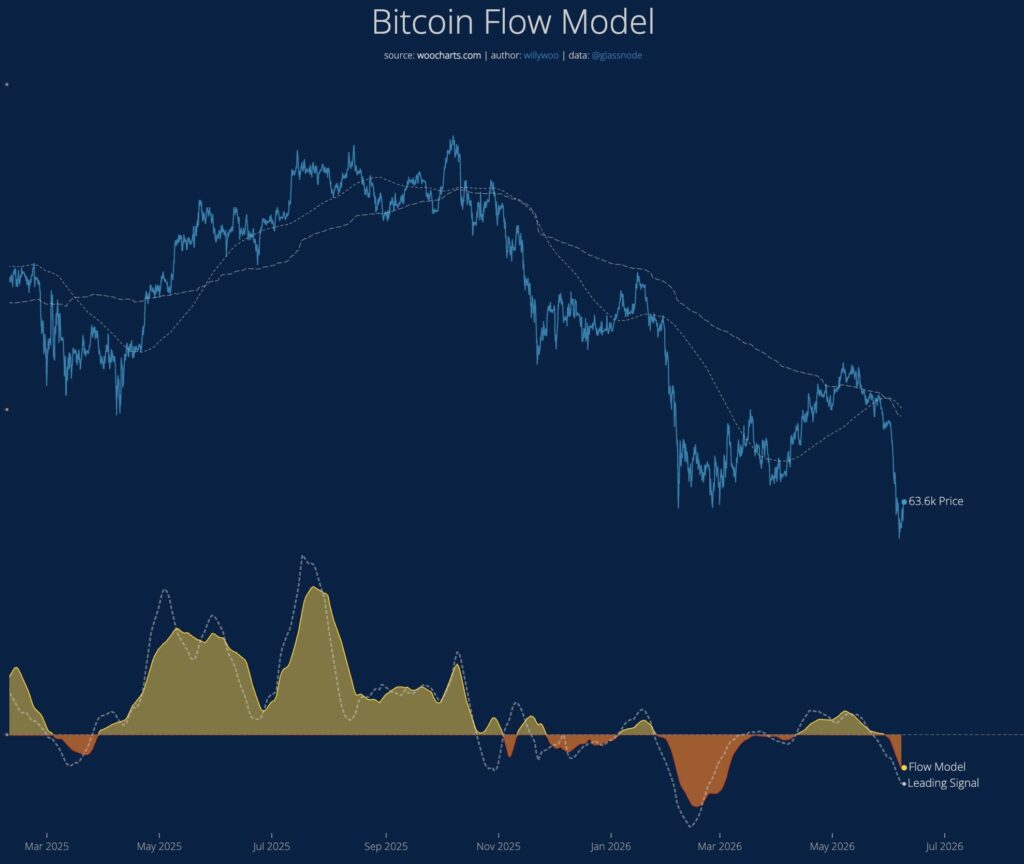
“I note that the bottom of the last bear market occurred with a sudden drop in price and a bullish divergence in flows,” the chain analysis specialist recalled.
“There is a possibility that this structure is a reflection of the December 2022 low. Therefore, I do not rule out a scenario where BTC is trying to bottom out amid market fear,” he weighed.
However, Woo urged caution due to overall macroeconomic environment. To confirm a solid uptrend, it requires certain risk indicators to fall and remain stable near zero before trading.
«The local panorama points to a rebound towards a lateral phase. We will have to see if liquidity arrives. If it doesn’t arrive, we will go even lower; If it arrives, we could observe the first signs of a possible formation of a soil,” summarized the analyst.
The current situation of bitcoin, according to the analysts reported here, would point to a rebound towards a lateral phase, ruling out for now a structural failure of the crypto asset to move on to a purification stage where euphoria mutated into caution.
But, BTC’s performance in the short and medium term will fundamentally depend on whether fresh liquidity reaches the currency; Otherwise, the lack of institutional capital will deepen the downward trend, while its return will confirm the definitive formation of a floor.