
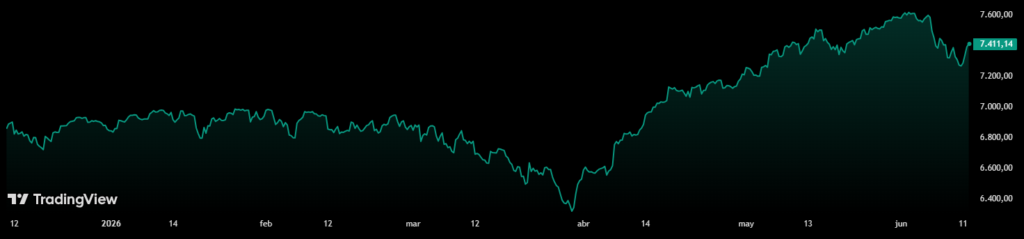
The S&P 500 index, which groups the top 500 companies in the United States, marked its all-time high on June 1, but has remained in a downward trend since then. Is this a normal market correction or could it be the start of a larger bearish move?
This fall, according to the visions that both the analyst Damir Tokic and the firm Mott Capital have presented independently of each other, would respond to a combination of external macroeconomic pressures and tensions in the internal structure of Wall Street. The current environment—according to them—shows an exhaustion in investor optimism towards volatile assets.
To put the situation in context, let us remember that the conflict in the Middle East has caused the blockade of the Strait of Hormuz, one of the most important maritime routes on the planet through which nearly 20% of the world’s oil circulates. This situation threatens to reduce world oil reserves to critical operational levels during this month of June.
As a direct consequence of this imbalance, the price of crude oil reached $114 per barrel on May 4, levels not seen since 2022, while it currently stands at $89.
However, the market still hopes that an agreement will be reached to reopen the Strait of Hormuz before global inventories reach a critical level.
In this sense, the researcher and financial advisor Damir Tokic warned on June 9, If the road remains closed or very restricted, “the cost of energy will skyrocket drastically”.
“We are facing an inflationary crisis, and the Federal Reserve (FED) will have to adopt a more restrictive stance, which is the first trigger for the stock market crash,” said the analyst.
This pressure is already materializing. The U.S. Bureau of Labor Statistics reported this week that the Consumer Price Index (CPI) rose to 4.2% year-on-year in Mayits highest reading since April 2023, compared to 3.8% in April, as reported by CriptoNoticias.

The technological slowdown bursts the bubble
To this macroeconomic panorama, Tokic adds the possible bursting of the bubble in the technology sector. “There has to be a singular event that sets it off, and that event was potentially the Broadcom report.”
Broadcom is a leading global firm in the semiconductor and technology infrastructure sector, whose shares and financial results serve as a key thermometer to measure the health and level of investment in the technology and artificial intelligence (AI) industry.
This firm’s most recent earnings report revealed that Artificial Intelligence (AI) Capital Spending Growth Hits Cyclical Peak. “Which signals to the market that AI capex growth is peaking,” Tokic said.
«Current valuations of semiconductor companies, as measured by the VanEck Semiconductor exchange-traded fund, are based on irrational growth expectations. The slowdown in spending on technological infrastructure will cause a contraction of multiples, reducing the equity value of these companies,” he explains.
Tokic projects that annual investment in AI will increase to $1 trillion by 2027. However, he clarifies that the growth rate “will slow well below that of 2026 and will continue to slow in 2028 and beyond.”
Valuations are based on growth rates, and a slowdown in these rates “implies a contraction in multiples, which alone could cause a bubble to burst. However, an inflationary crisis and rising interest rates could cause a decrease in investment in AI by 2027, and this could be the real trigger for the collapse,” says the analyst.
Numerical imbalances fracture Wall Street
From a technical perspective, the analysis and investment firm Mott Capital identified that The main risk lies in the “stock market microstructure”. Current data reflects a historical disconnect between the performance of individual stocks and broad indices.
Mott Capital analysts explain that the implied volatility of individual stocks is trading at extreme levels, with the VIXEQ indicator standing around 45 points (this measures the expectation of risk and shocks but at the level of individual companies). On the contrary, the S&P VIX index, which measures the general volatility of the stock market, remains low, close to 17.6 points.
This disparity of 27.5 points represents the largest difference recorded to date in financial records. “This difference or disparity between volatility at the component level and at the index level is one of the main reasons why dispersion in the S&P 500 remains at historical highs, as seen during the COVID-19 crash and the tariff crisis,” the firm explains.
Mott Capital notes that, at the same time, three-month implied correlations are at an all-time low of 10 points. Such a low reading was only observed in July 2024, just before the global collapse of foreign exchange arbitrage trading with the Japanese yen.
The mathematical danger would increase if the S&P 500 e-mini futures break the technical support located between 7,350 and 7,400 points. Mott Capital analysts detail that losing this “floor” of protection will automatically activate the massive selling algorithms of systematic investment funds based on raw materials, executing programmed orders to protect your capital against market declines.
Likewise, the market is heading towards a regime of gamma negative, a condition where options brokers are forced to sell shares to cover their losses. The graph shows the net exposure of gamma for the S&P 500 (SPX) divided between green bars (positive gamma/Calls) and red bars (negative gamma/Puts) at different strike prices (Strikes).
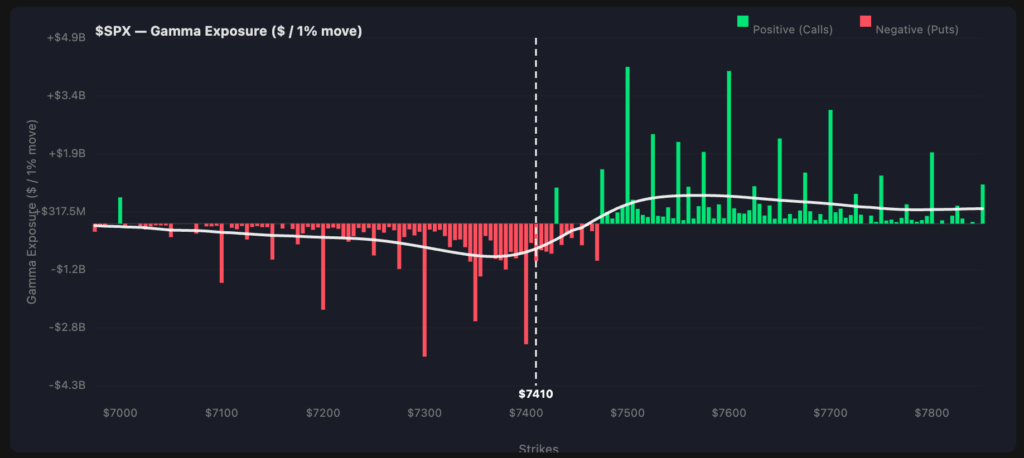
The level of 7,410 points marked with a dashed line represents the turning point. Above this level, exposure is predominantly positive (green bars), which helps dampen volatility. However, below 7,400 points it enters an area massively dominated by negative exposure (red bars). This “will accelerate the falls mechanically towards the support zone of 7,300 points,” the firm warns.
The market appears to be overextended from a positioning perspective and is approaching levels where selling pressure could mechanically accelerate. This type of pressure does not depend on headlines or news; It is driven by market positioning and structure.
Mott Capital, analysis and investment firm.
Seasonal employment stops the collapse
Faced with these collapse alerts, labor hiring data in the services sector show significant nuances. “It is possible that the 76,000 jobs created in the hospitality sector and the 50,000 in local administration were due to the Soccer World Cup,” commented Tokic.
By excluding these seasonal and temporal factors, the labor market report is structurally weak. This weakness contradicts the hypothesis of economic overheating (a phenomenon where the economy grows too quickly with excess employment and consumption, triggering inflation), demonstrating that the real market is not out of control.
In turn, this scenario of labor fragility reduces the incentives for the FED raise the price of money (i.e., increase interest rates). If real economic activity is weak, the Federal Reserve loses reason to make loans more expensive and cool the market even further; On the contrary, it gives you an argument to keep rates stable or even lower them to stimulate the economy.
Meanwhile, Mott Capital indicates that institutional flows in the derivatives market demonstrate that semiconductor call option premiums remain high. This indicates that Demand for tech stocks on traditional stock exchanges hasn’t completely collapsed.
The persistence of these purchases helps support the prices of the large Wall Street firms. As long as market makers maintain their liquidity at these support levels, forced liquidation algorithms will not activate immediately.
The evolution of the stock markets in the coming weeks will depend on the interaction between geopolitical stability and technical contracting supports. A break in quantitative limits will confirm the change in the economic cycle towards a prolonged contractionary phase.