
More than 10 million bitcoin are currently in unrealized losses.
Bitcoin is 49% below its all-time high, reached in October 2025.
An on-chain metric that appeared near bitcoin (BTC)’s major lows since 2010 became active again during the early days of June 2026, as the asset struggled to hold the $60,000 level.
This is the supply in losses (supply in lossin English), an indicator that measures how many BTC are in addresses whose estimated purchase price is higher than the current price. In other words, shows how many coins would generate losses for their holders if they were sold at the market price.
The following graph shows the evolution of the price of bitcoin (yellow line) and the amount of BTC in unrealized losses (green line).
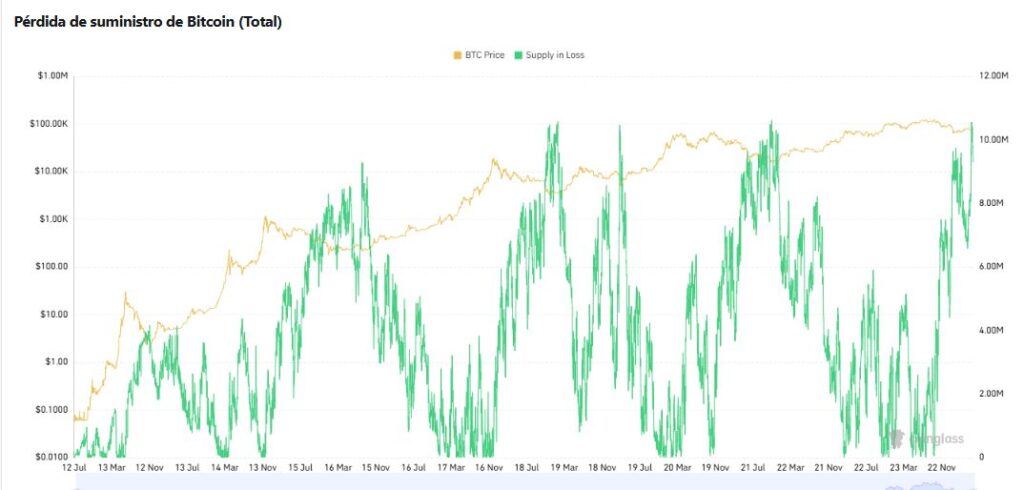
Currently, with 20.4 million bitcoins issued, when the green line exceeds 10 million BTC, it means that more than half of the circulating supply is in unrealized losses.
The 50% loss threshold was also seen in the bear markets of 2015, 2018, 2020 and 2022. In all of these cases it coincided with minimum areas or very close to them, before bitcoin began a new bullish phase.
The activation of the signal occurred after a drop of close to 49% from the all-time high (ATH) recorded in October 2025.

During that period, the market faced headwinds such as the war in the Middle East, heavy capital outflows from spot bitcoin exchange-traded funds (ETFs) in the United States, and Strategy’s first BTC sale in over four yearsas reported by CriptoNoticias.
The signal does not confirm a definitive floor
Although the historical behavior of supply losses is relevant, It does not guarantee that the market has found a definitive bottom.
To evaluate that risk, the analysis team of the research firm Múltiplo Investments observe another on-chain metric: realized price. This indicator calculates the average acquisition cost of all bitcoins in circulation.
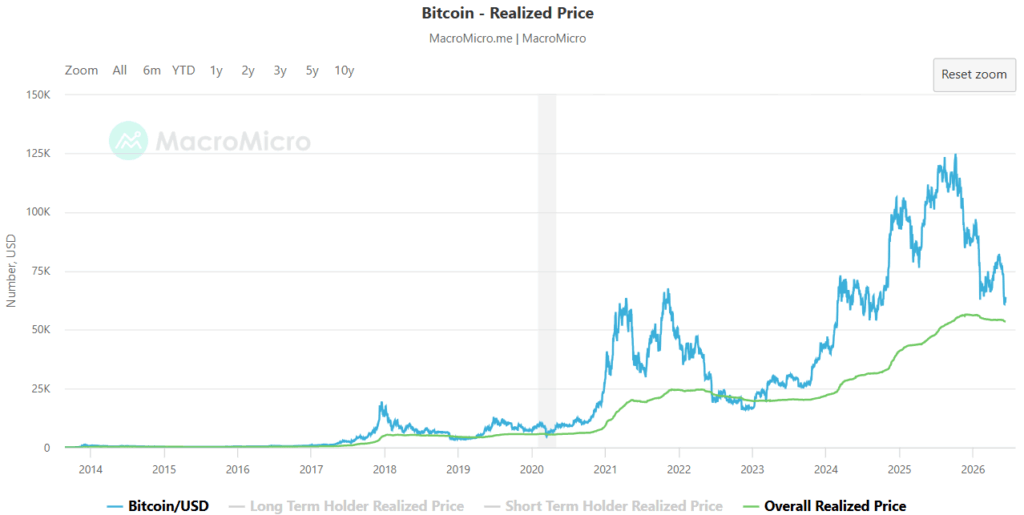
Historically, during deeper bear markets, BTC tended to approach or even temporarily pierce that level before completing a bottom formation.
According to the firm, “bitcoin has never made it through a crypto winter without reaching the realized price.” Under that premise, he adds: “If BTC respects this correlation, prices would fall to $53,000.”
The tension between both metrics summarizes the current scenario. In this framework, next movements of bitcoin It will be key to defining whether it has already marked a cycle floor or if the market still has to go through a new stage of downward pressure.