
Bitcoin (BTC) has registered strong volatility in recent days, after reaching a new historical record of $ 111,900. After that record, the price faced strong resistance and fell to the USD 101,000. But the market showed signs of recovery, and returned to the field of USD 110,000.
In all this, the USD 115,000 per BTC is They emerge As the next key resistance to the price of the digital asset, according to the Glassnode market analysis firm.
The expectation for seeing major contributions in BTC arises, in part, from the fact that, during the fall of BTC to 101,000 dollars, which was 9% on average, Investors did not panic or sell massively.
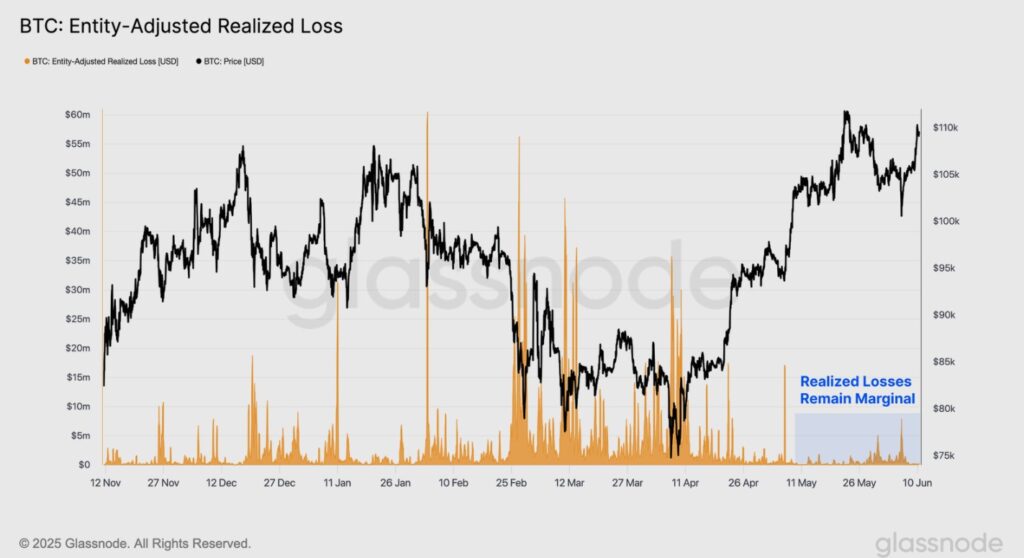
Of course, not all investors reacted in the same way. Yes there were sales during the fall of BTC and, for the most part, they came from people who bought Bitcoin recently. These are known as short -term holderssince they acquired BTC shortly before their historical maximum. When the price dropped, some of these new investors decided to sell, probably because they did not want to lose more money.
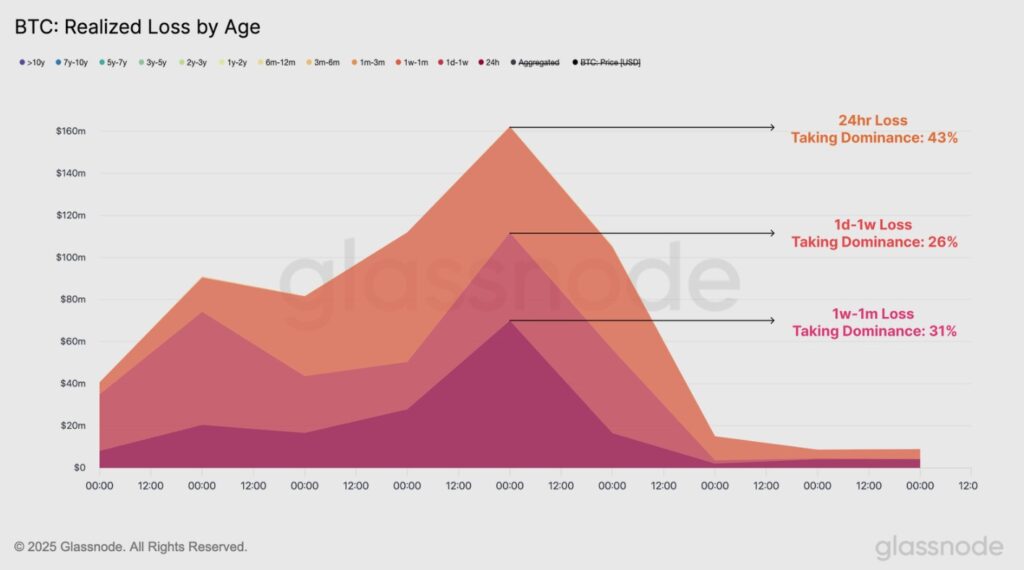
Glassnode data indicate that 43% of the losses came from people who bought in the last 24 hours, 26% of those who bought between 1 day and 1 week before and 31% of those who bought between 1 week and 1 month before, as seen below:
In contrast, the most experienced investors, those who have had BTC for months or years (also called long -term holders), did not sell during the BTC price drop.
This indicates that those who left their holdings were mainly the newest and most speculative investors, while those who have been in the market They trusted that the price would recover.
Although temporary, it is a behavior other than the one observed in recent days, when experienced investors were selling their holdings, as cryptootics reported. This is because, since the historical maximum of USD 111,800 was reached, the areas where investors used to enthusiast They became sources of sales pressure.
Key levels for the price of Bitcoin
With Bitcoin so close to its historical maximum, it is useful Look at some key prices levels To understand what could happen. There are two types of levels that we can analyze: technicians (based on price patterns) and on-chain (based on chain data).
As for technical data, we can support ourselves in mobile averages, which are lines that soften the price movements. These are a common tool to assess whether the market is strong or weak.
Here are some important levels, according to Glassnode:
- 111 -day mobile: 92,900 dollars.
- 200 -day mobile average: 95,400 dollars.
- 365 -day mobile average: 81,700 dollars.
With this graph these averages can be better appreciated:
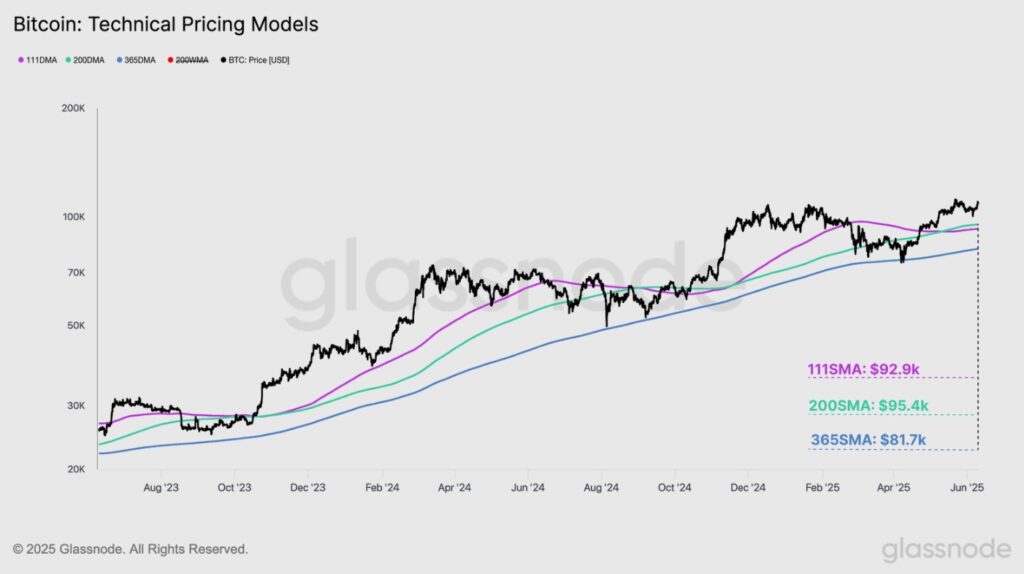
That Bitcoin is above these levels is a good sign, since it indicates that the market has strength. On the other hand, if the price fell below 92,900-95,400 dollars, It could be a sign that the impulse is weakening. On the other hand, staying above these levels suggests that Bitcoin remains in an upward trend.
A price close to those indicated by Glassnode, of USD 94,000, was already identified before as a key support level for BTC, since more than 420,000 bitcoin They have their cost base in that price. That would make that price zone a solid support of the current cycle, given the supply concentration that accumulates there, as cryptootics reported.
As for the on-chain indicators, the cost of the short-term holders, which is the average price to which new investors bought Bitcoin, offers an interesting perspective.
Currently, this level is at $ 97,600. If the price falls below this level, I could indicate that the market is entering a bearish phase. On the contrary, if it remains above, it is a positive signal.
We can also look at bands around this level to have an idea of where the supports and resistances are:
- Resistance (+1 standard deviation): 115,400 dollars.
- Support (-1 standard deviation): 83,900 dollars.
This graphic illustrates it better:
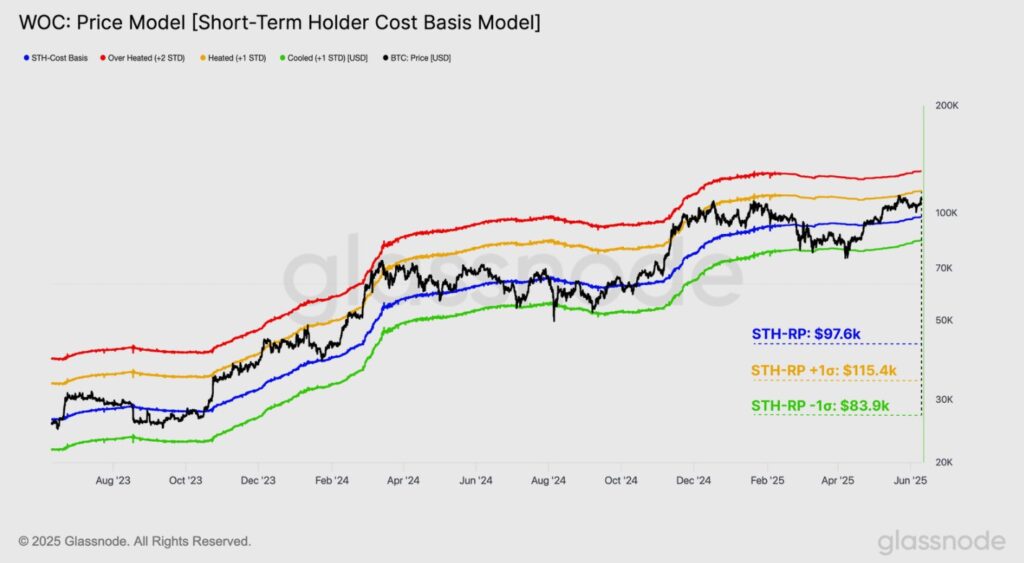
During the recent fall, the price approached $ 97,600, but found buyers at $ 101,000, which avoided a larger fall. This is good news, since it shows that investors are willing to buy when the price drops a bit, as well as their trust is still solid.
It should be noted that this behavior is usually called, within the bitcoiner jargon, such as “Buy The Dip”This is precisely to acquire more coins when the price of BTC corrects. Great personalities have“ bought the DIP ”in past falls, such as Michael Saylor, head of the Strategy firm, or Nayib Bukele, president of El Salvador, as reported by cryptootics.
On the other hand, these levels show that the next challenge to be overcome by BTC is the USD 115,400, a price that He would test investors, as well as their convictions. It is a price similar to that indicated by the financial analyst Willy Woo, who sees in the USD 114,000 a key level for the upward trend.
An exciting situation
At this time, Bitcoin is in an exciting situation, quoting very close to its historical maximum. Some experienced investors are taking advantage to take profits, but they are not selling everything and the amount of bitcoin that the whole of this investor cohort has continues to grow. This is different from previous cycles, where long -term holders used to sell more when the price was high.
At the same time, there are signs that the market could become more volatile, especially because many people bought BTC at prices close to the current one. However, Option operators seem confident that there will be no big changeswhat could be a sign that volatility is close.
For investors, it is important to monitor key levels such as $ 97,600 (support) and $ 115,400 (possible resistance). If BTC is maintained above mobile averages and the cost of short -term holders, the upward trend could continue. But if it falls below these levels, We could see a phase of greater uncertainty.
Bitcoin continues to show strength, but the market is at a critical point. The trust of investors, the accumulation of Bitcoin and the entry of institutions They are marking this cycle as unique.

