
There was a decrease in profits made.
The institutional interest remains firm, with consistent and considerable entries.
From the ’12 days war’ between Israel and Iran, when an important fall in the price of Bitcoin (BTC) to the USD 99,000, the largest digital asset in the market has been recovered and stabilized around USD 107,000. Although high, this figure is insufficient for traders, who expect higher prices before taking profits.
The market has managed to maintain the level of short -term cost support despite high volatility and uncertainty, which is a positive signal. This indicates that buyers (bullies) still dominate and that The trend could continue to be upwardsaccording to the Glassnode analysis firm.
If traditional market capitalization is analyzed, which values each currency in the current offer to the current market price; as well as the capitalization made, which values each currency at the last negotiated price, A substantial growth can be seen.
In the case of market capitalization, there was an increase to 2.13 billion dollars, from a minimum of 304,000 million dollars. While the capitalization made has increased from 400,000 million dollars to 958,000 million dollars, as seen in the following graph.
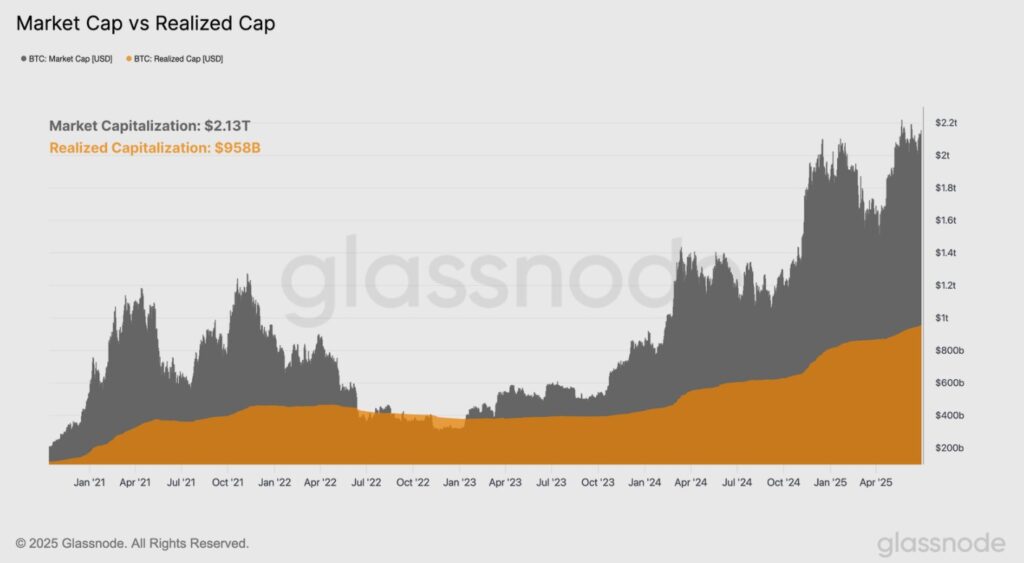
“Together, not only the important capital tickets in Bitcoin stand out, but also their maturation to become a billionaire asset,” said Glassnode.
Show this is that Bitcoin is already more valuable that several internationally renowned companies and entitiesas goal Platforms (Facebook), Tesla, Jpmorgan Chase and Berkshire Hathaway, to mention some, as seen below:
Raise profitability
The total benefit not made, which is the difference between traditional market capitalization and capitalization made, It is estimated at USD 1.2 billion. This underlines the “substantial appreciation of the value” experienced by Bitcoin investors, “but also the incentive for the possible sale pressure that can arise if the feeling changes,” warns the firm.
Measuring with the MVRV, an alternative vision of investors’ profitability is obtained, since this metric calculates the relationship between market capitalization and capitalization made. This provides Crucial information on the magnitude of profits or losses on paper that the average market participant has.
At the moment, the MVRV stands at +125%, which suggests that Bitcoin investors have important benefits. Although notable, it is still substantially lower than the profitability of +185% observed in March 2024, when the price reached the historical USD 73,000, and also when the market initially exceeded USD 100,000, in December of that year, when it reached +177%, as can be seen in the following graph:
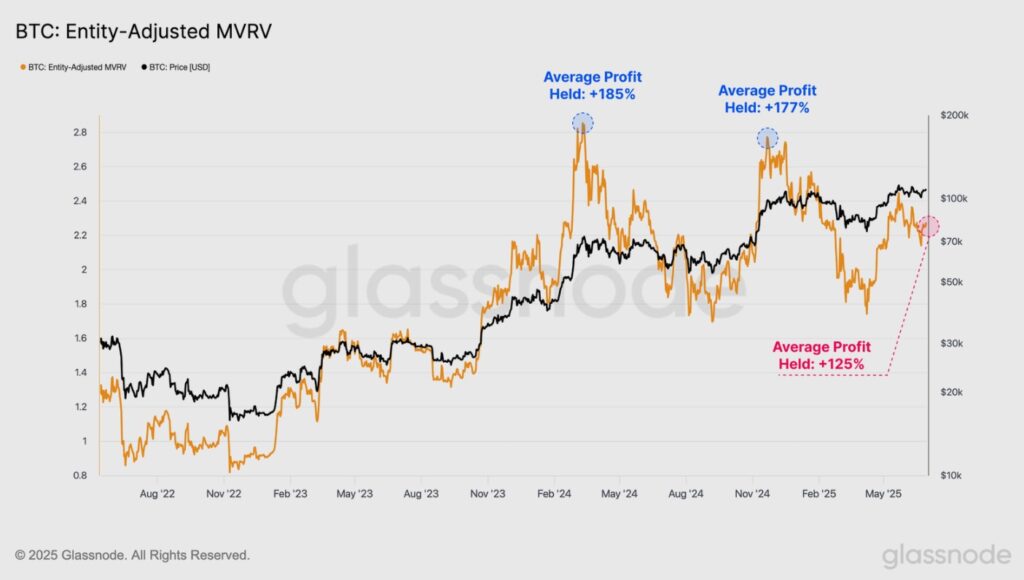
With the benefits not made in dollars quoting near the historical maximums and the MVRV ratio below the peak compared, a clearly reflected a divergence between the two profitability measuresthus suggesting that the capitalization made (capital tickets) has grown at a relatively faster rate compared to stock market capitalization (pricing) in recent months.
Waiting for better times
Seen that the Bitcoin market has important benefits, it is necessary to press the reaction of investors and know if they are taking profits. To do this, the magnitude of the profits or losses blocked by the transactions that occur in the chain every day is observed.
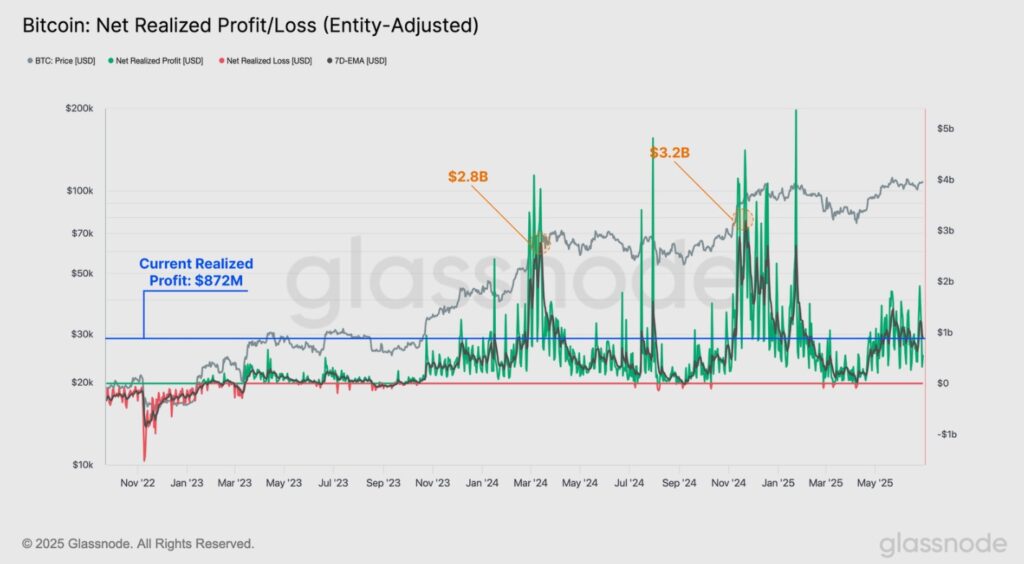
In general, the benefits made have been maintained relatively moderate in recent weeksalso considering that the price of BTC is very close to a new historical maximum.
Around USD 872 million dollars are currently blocked in profits per day, which is remarkably less than the USD 2.8 billion and USD 3.2 billion in profits made observed during the USD 73,000 historical formations of USD 73,000 and USD 107,000, respectively, as seen in the following graph:
The decrease in the sale pressure in the Bitcoin market is particularly evident when examining the total supply of long -term holders, which Recently reached a historical maximum of 14.7 million BTC.
This emphasizes that Holding remains the dominant market behavior Among investors, since accumulation and maturation flows significantly exceed distribution pressures, emphasizes Glassnode.
The 155 -day mobile average required for coins to enter the cohort of long -term holders, is currently approaching the formation of the second historical maximum at the end of January this year. This indicates that investors bought above $ 100,000 They have grabbed their coins largelyevidencing a “constructive feeling under the surface.”
The feeling to keep the coins and wait better times before selling is also evidenced in the Livess metric, shown below, than Evaluate the historical balance between spending and holding. During bullish trends, spending is investor preference. While, in bassists, Bitcoin accumulation is the dominant market behavior.
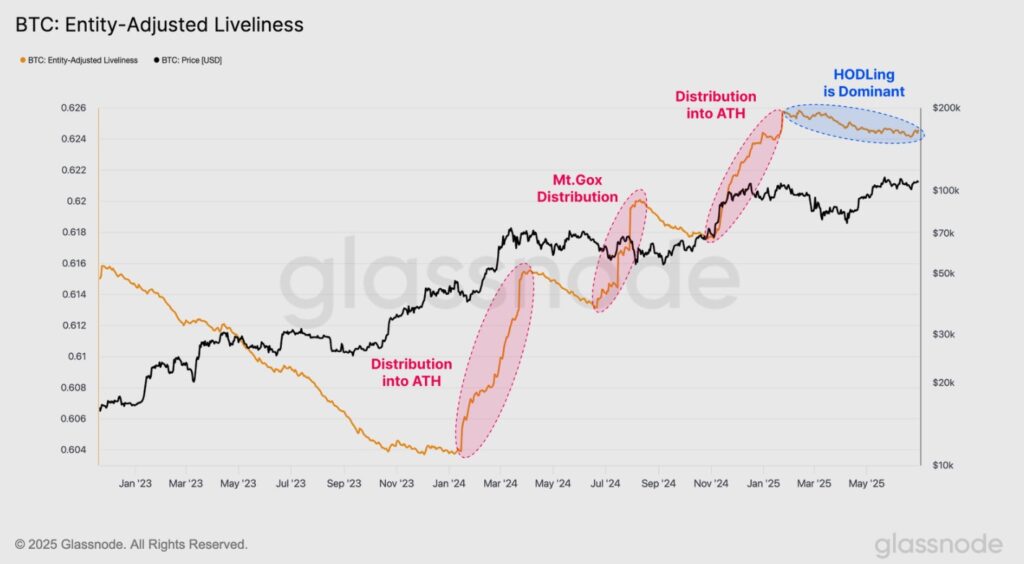
As can be seen, in the last historical maximums, Livess metric experienced significant increases, highlighting a market dominated by spending activity and gain taking. Now, this behavior was absent during the recent $ 111,000 record, as seen below:
This further reinforces the fact that The accumulation remains the dominant behavior Among investors, and, therefore, “an expansion of the price range may be necessary to encourage a renewed expenditure activity,” says Glassnode.
The trend is reaffirmed by the risk ratio on the side of the sale, which is used to measure both the activity of investors in the markets and if the market is approaching the degree of balance. When the values are high, investors are obtaining significant profits or losses in relation to their cost base. And when they are low, the coins are spending near their original cost base, indicating that the profits and losses have decreased.
Now, after a rebound in the collection of benefits during the recent historical maximum, short -term holders have significantly reduced their distribution pressures. This suggests that the current price range It is not convincing enough As if investors continue to sell their coins. In the end, this implies that the market may need to raise (or even lower) to unlock an additional offer.
This same accumulator behavior is extrapolated to long -term holders, who also have Preference for keeping your coins and wait better market conditions, rather than sell them, according to on-chain data.
The tendency to accumulate and wait for better times in the market has been expressed for days, with a reduction in the BTC trading activity and a weak participation of investors, who doubt whether to compromise their capital, as cryptonotic reports.
Institutional commitment is maintained
Along with the generalized sharing feeling among Bitcoin investors, the institutional commitment to this digital asset It has been widely evidentespecially through the net flows towards the Bitcoin ETFs that are negotiated in the United States.
In general, net entries added have accelerated in recent weeks, reaching an average peak of 7 days of more than 298 million dollarsas seen in the following graph.
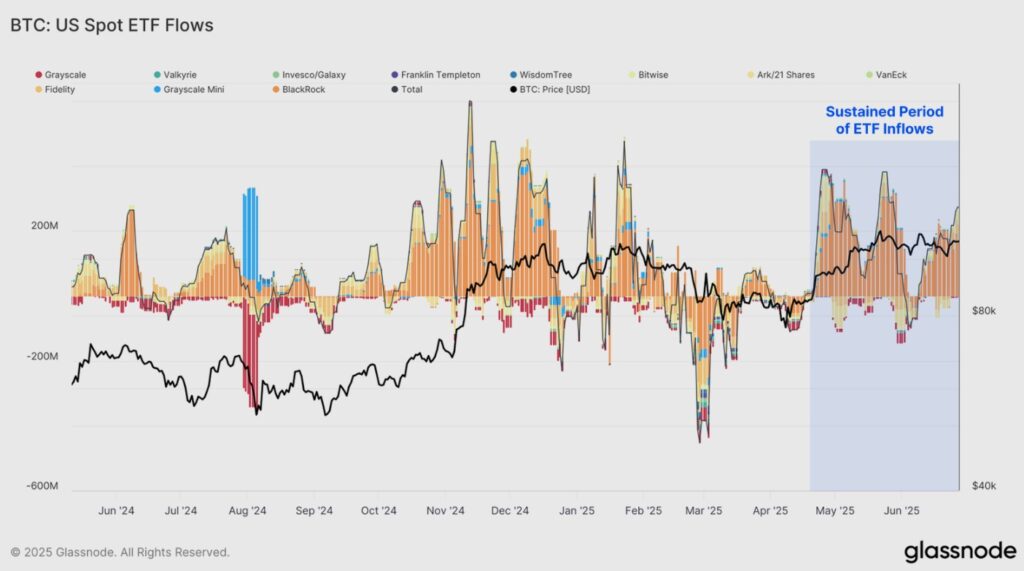
This sustained and considerable pressure of the buying part is a “constructive signal that highlights the growing large -scale institutional commitment,” says Glassnode.
Net capital flows to Bitcoin ETFs are an important factor for price behavior, since they can induce a rise or a decrease in the btc price. This is because the funds, which are regulated and are part of the traditional financial system, must buy or sell digital currencies in the market to support their financial product. This influences Bitcoin’s supply and demand.
As can be seen in the following graph, since Bitcoin ETFs were issued in the United States, in January 2024, and so far, most months They have been of significant capital entries Towards these financial products.
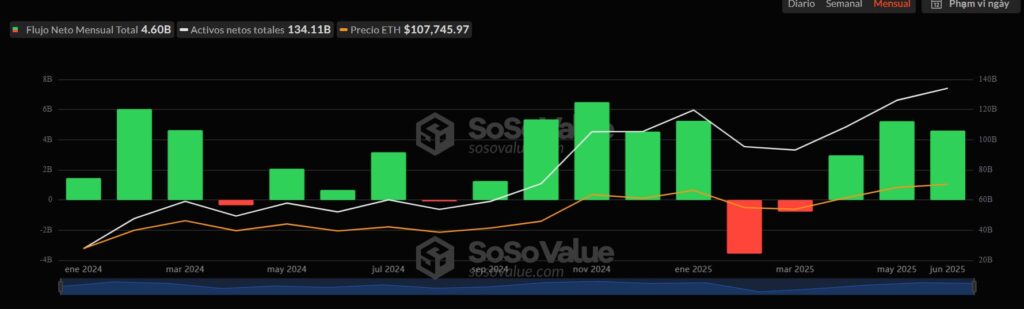
This performance in the flow of capital to the ETFs, in part, explains the Increase that Bitcoin has had in the same periodwhich reaches 150%, after passing from USD 40,000 in January 2024 to USD 107,000 in June 2025, as seen below.
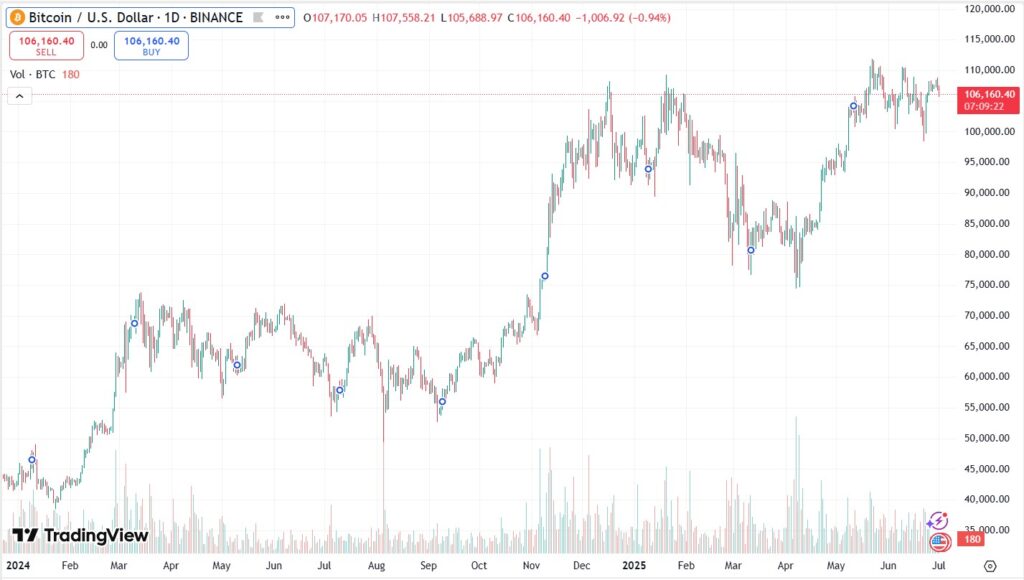
This makes us understand that, to the extent that institutional commitment to Bitcoin is maintained and positively influenced the price, it is feasible that better times come For investors who await patiently to take profits.

