
Despite the falls and lateralizations, the general structure of Bitcoin remains bullish.
Bitcoin’s corrections are being less and less deep.
Bitcoin (BTC) moves below its historical maximum and, at first glance, there are no signs that there will be an upcoming rebound.
However, analyst Olivia Hayes, from the community of TrainingViewIdentify signals that reinforce investor confidence and anticipate a significant movement on the horizon.
The cryptoactive – says Hayes – maintains a clear bullish dynamic. Every minimum in the price is higher than the previous one, it shows that sellers fail to impose itself.
The 117,800–118,000 area has been repeatedly tested and remains solid, reflecting sustained control by the demand. This support acts as a foundists that buyers defend firmly, stands out The specialist.
As can be seen in the following graph, the long -term trend is clearly bullish, as indicated by the large blue arrows pointing up. Red shaded areas represent consolidation or accumulation areas where the price moves laterally before continuing its ascent. As can be seen, Bitcoin has already repeated this accumulation pattern several times in its recent history, and then break up.
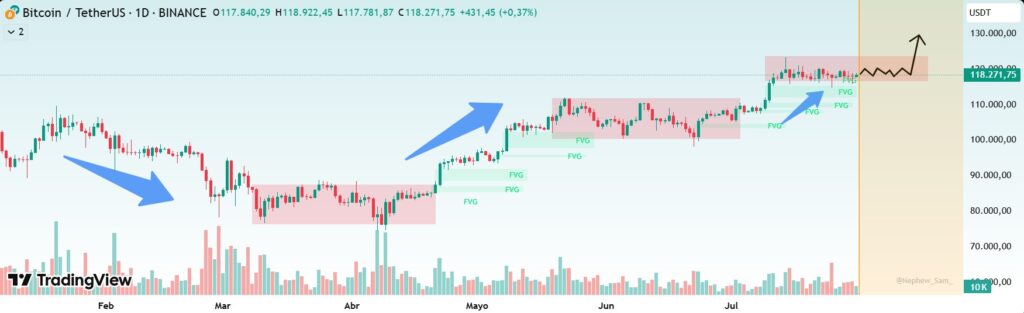
These areas act as solid supports, where buyers have defended the price of major falls. The current area of 118,000-119,800 dollars (highlighted in the right end of the graph with a red box) is the most recent of these consolidations.
‘Fair Value Gap’ is the price magnet
A key technical factor is the presence of a Fair Value Gap (FVG) between $ 121,000 and $ 123,000, as observed in the previous graph. A FVG is an area in the graph where the price moved quickly, leaving a liquidity vacuum that tends to be filled by the price action.
The lowest FVG have already been closed almost entirely, which reduces the bearish pressure and opens the door to an impulse to higher levels.
In addition, recent Bitcoin corrections are less pronounced, a sign of depletion of vendors. This behavior suggests that buyers are accumulating positions gradually, preparing the land for a bullish movement. Market resilience is evident, even in the face of macroeconomic events that usually generate turbulence.
According to Hayes, a daily closure above $ 119,800, accompanied by a volume greater than the average, could trigger a rally around 122,000–125,000 dollars.
This area coincides with open FVG and previous resistance, which makes it a key technical objective. The Glassnode firm supports this perspective, highlighting that Bitcoin is consolidated below its historical maximum of $ 123,000, but with signs of preparation for upward break.
Bitcoin projections persist
To exceed $ 125,000 clearly, the price could point to $ 141,000, a technical and psychological level where a strong sales pressure is expected due to unrealized profits, as Cryptonotics reported.
However, Bitcoin faces a key support between $ 110,000 and $ 115,000 in case of correctionwhich limits the downward risk. Among these levels, the market shows an absorbed consolidation with solidity, reinforcing the upward narrative.
The combination of a bullish structure, less deep corrections and key technical zones suggests that Bitcoin is in a phase of accumulation. While buyers maintain control, the market seems to prepare for a movement that could redefine their trajectory in the short term.
