
The bitcoin (BTC) market has gone through a phase of volatility in recent days marked by a drop to USD 80,600. But the recent bounce towards $88,000 suggests a possible local bottom, backed by the market’s dolphins and sharks.
Bitcoin on-chain data reflect that intermediate groups of investors provided support to the BTC price. This, amid the 20% drop from highs.
According to Spanish on-chain analyst Carmelo Alemán, bitcoin could have formed a local bottom. It would be supported by the accumulation of holders of 100 to 1,000 BTC, which is the group made up of dolphins (100–500 BTC) and sharks (500–1,000 BTC).
What do Bitcoin’s on-chain graphs say?
CryptoQuant’s cohort accumulation and distribution graph clearly shows this divergent behavior. It shows that dolphins and sharks maintained a stable accumulation linerepresented by the reddish stripe. This was before falling below zero along with bitcoin’s correction, suggesting they stopped absorbing supply and started delivering liquidity to the market.
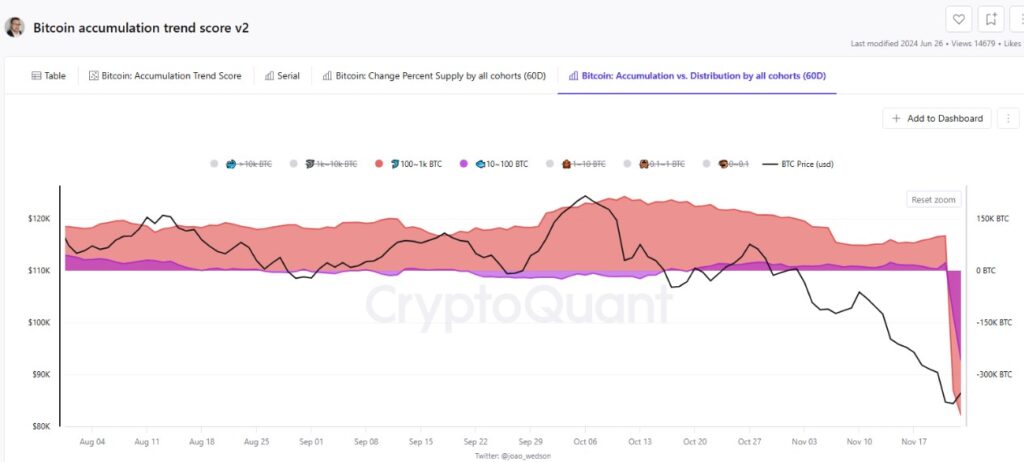
Despite support for the bitcoin price from dolphins and sharks, the largest cohorts—whales and great whales—behaved erratically. The latter, pressing the price of the asset downwards.
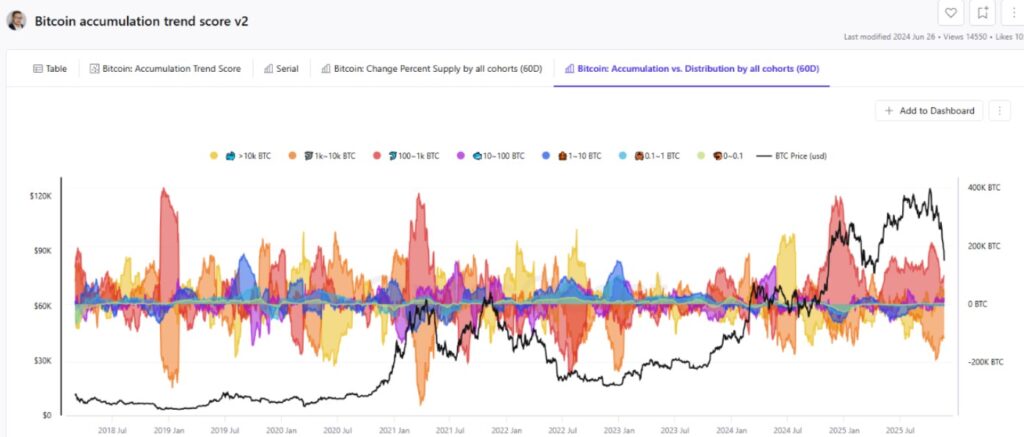
According to Alemán, groups of more than 1,000 BTC “remain mostly negative,” reflecting sustained selling. “The conclusion is that the big players continue to unload supply,” express.
This behavior is reflected in the accumulation/distribution graph below, where it is evident that both segments They have put constant pressure on the price of bitcoin.
Retail has not acted as a buffer either. Alemán points out that, in the last 60 days, holders of 0 to 1 BTC and 1 to 10 BTC—fish, crabs, and octopuses—have shown net sales, not accumulation. This is what it looks like below:
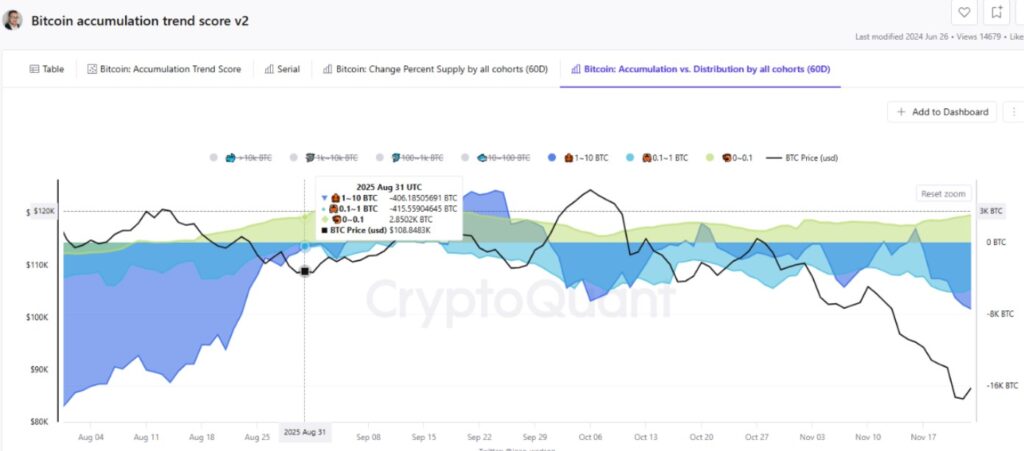
The conclusion is that “the retail public is not supporting the market, but is contributing to distribution,” according to Alemán. He further highlights that bitcoin’s recent correction was not only driven by big players, but also by small holders. They took advantage of the fall to reduce exposureassures the analyst.
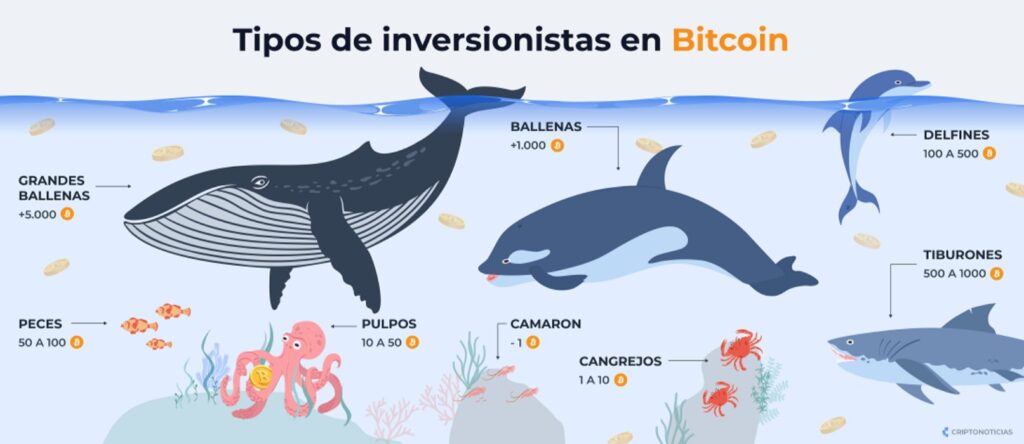
In this infographic from CriptoNoticias we clearly illustrate what the types of investors in bitcoin are, identified as different marine animals:
A sweep of leveraged positions in bitcoin
The drop to the area close to USD 80,000 was not solely a product of the spot market. The Spanish analyst emphasizes that “bitcoin fell mainly due to a massive sweep of long positions, selling pressure from futures and cascading liquidations.”
For the specialist, “the conclusion is that leverage turned a normal correction into a violent fall.”
Additional data from analysis firm Glassnode reinforce this diagnosis. The company highlighted that bitcoin’s fall “deepened the ongoing pullback and brought the asset into an area where demand historically tends to strengthen.” Although he clarified that the trend remains bearish.
Glassnode highlights that the mid-$80,000 range has shown “notable defense that suggests possible stabilization if selling pressure continues to moderate.”
This is evidenced by the momentum indicators, which remain oversold, with the 14-day relative strength (RSI) showing exhaustion and beginning to turn higher.
For that market analysis company, bitcoin could be forming “an early bottom structure within the range of $84,000 to $90,000.”
However, Alemán warns that we cannot yet speak of a confirmed reversal. The key, he says, is a clear change in the whales’ behavior. For him, as long as the 1,000 to 10,000 BTC group continues to sell, The bearish trend will continue.