
Risk appetite is weak because investors feel insecure.
Outflows and lower prices reinforce each other, impacting BTC performance.
The price of bitcoin (BTC) is at a time when macroeconomic conditions provide little support and the flow of capital into ETFs continues to deteriorate.
According to a recent analysis by the firm Ecoinometrics, the digital asset “is stuck in a loop” where capital outflows and lower prices reinforce each other.
The report stands out that the risk appetite “is weak” currently because Investors are uncertain about the outlook. “And financial conditions are stable rather than relaxing,” the document notes.
“That combination does not completely explain the magnitude of the correction, but it does explain why there is so little support on the fall,” explains the firm.
The core of the problem, according to Ecoinometrics, is in bitcoin ETFs, which are going through a new regime of persistent outflows, as seen in the chart below:
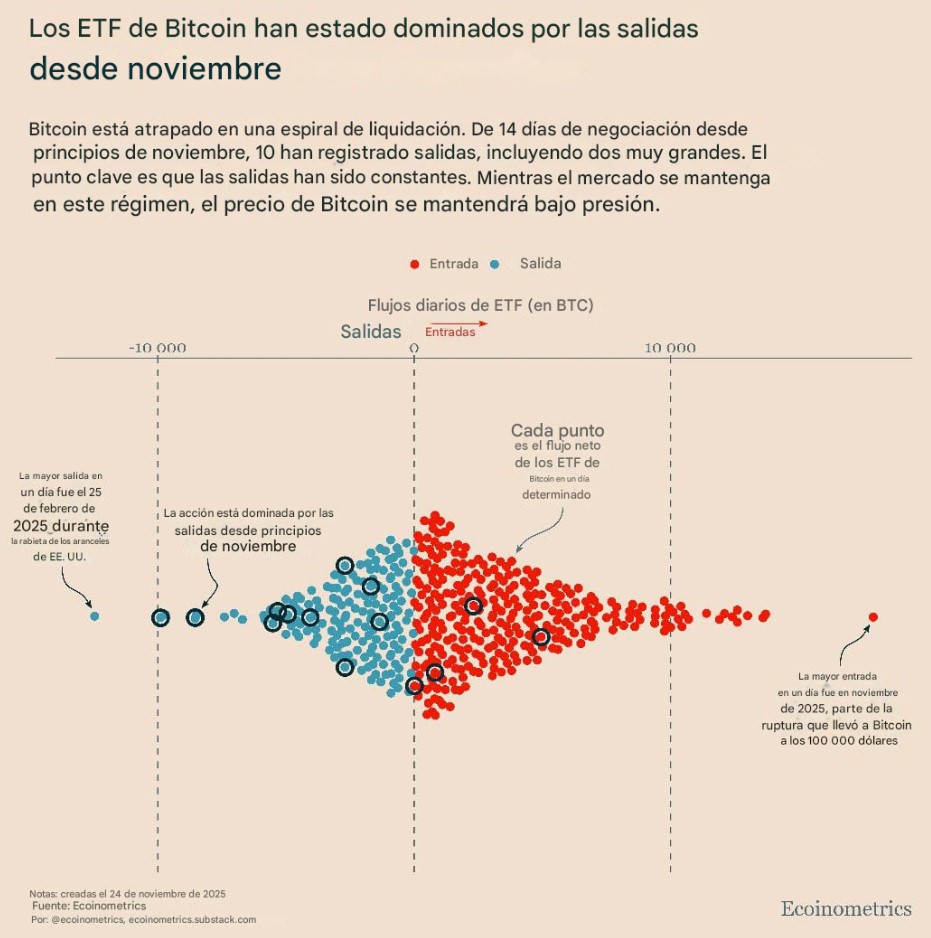
The entity remembers that when investors redeem shares, the issuers of these funds must sell the bitcoin that backs those titles.
“That sale pushes the price down, which triggers more redemptions, and the loop continues until the cycle runs out,” the entity states. The data shows that it is not just several consecutive days of departures, but flows “deeply located in the negative tail” of the historical pattern.
“Which is characteristic of a flow-driven settlement regime, not a normal two-way trading period,” the study notes.
Bitcoin ETF flows return to March levels
In parallel, 30-day capital flows have returned to the levels observed during the March correction. This evidences a significant drop in buying appetite by institutional and retail investors.
According to the analysis, as long as this metric does not show clear signs of stabilization and a subsequent sustained rebound, it is unlikely that the price will be able to build a solid floor from which to begin a consistent recovery.
The reason is that there is a well-defined statistical relationship between capital inflow and price dynamics. As Ecoinometrics explains, “every additional 10,000 BTC of inflows corresponds, on average, to a 3.5% increase in price.” This link suggests that the market is highly dependent on the constant flow of new demand to counteract selling pressure and sustain the current valuation.
In the absence of that fuel, even small bouts of selling can have a disproportionate impact.. It, delaying the formation of robust support and prolonging the phase of weakness.
The following graph shows the capital flows towards bitcoin ETFs, showing their deterioration in recent weeks. Currently, flows are at levels not seen since March of this year.
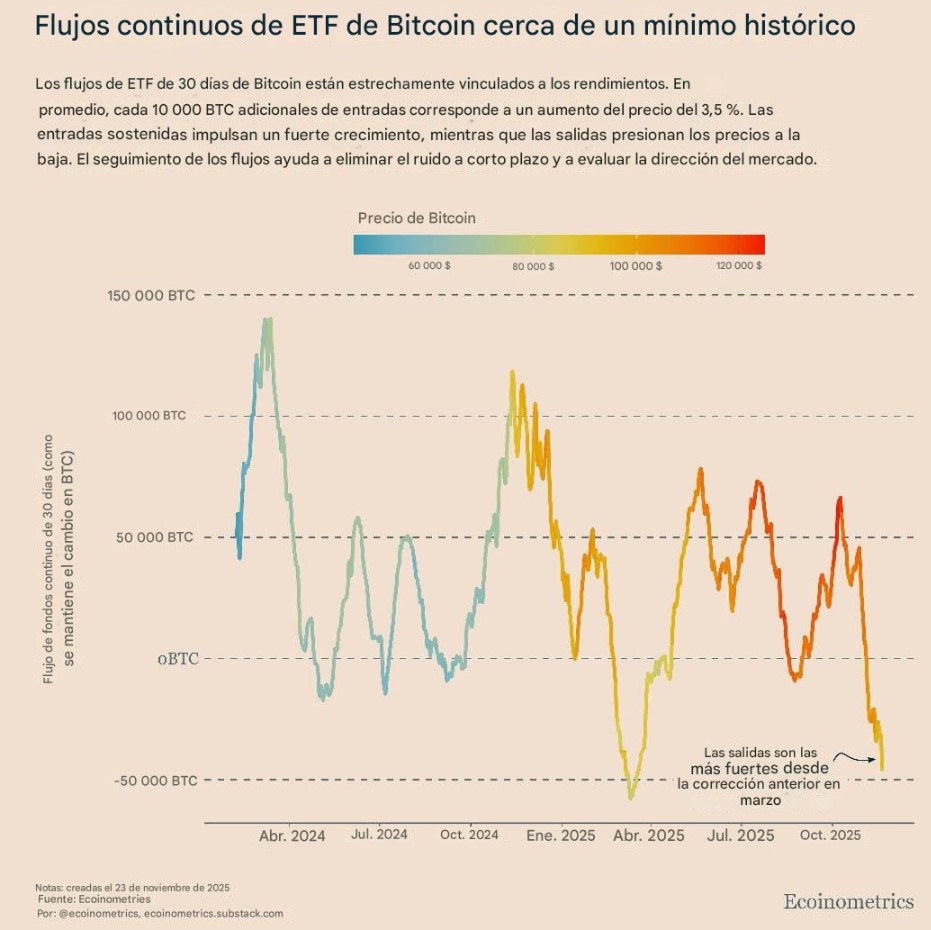
The alarming thing is that, according to Ecoinometrics, there is, so far, no “sign of stabilization.” So the point of exhaustion will arrive “when this curve flattens and begins to rise again.”
The short term of the bitcoin price is uncertain
Juan Blanco, CEO of BitData Consultores and specialized investor, explains to CriptoNoticias that the macroeconomic environment adds pressure to the ecosystem. This, considering that the short term of bitcoin “is uncertain due to its high volatility and dependence on macro factors.”
For Blanco, the current bearish behavior of BTC and the cryptocurrency market in general “depends largely on global liquidity and the direction of capital towards so-called ‘risk assets’.” In addition, of course, to the negative impact of ETFs in recent weeks.
From their point of view, the interaction between these factors keeps the price of BTC in an intermediate state without immediate catalysts. This, with lateralizations above USD 80,000, as seen in the following graph:
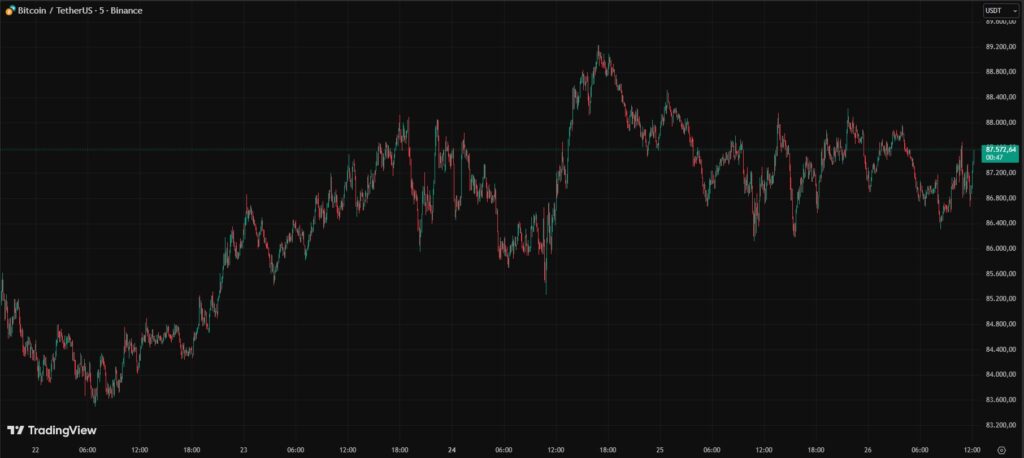
In the long term, however, Blanco maintains that bitcoin macrotrend remains bullish thanks to foundations such as the programmed scarcity of the protocol, growing institutional adoption and its narrative as a store of value.

Remember that the maximum supply of bitcoin is 21 million coins and that halvings every four years reduce the issuance, “which has historically driven appreciation cycles,” he points out.
It also highlights the progressive integration of bitcoin into global financial markets, the advancement of ETFs and the growing use of this currency as coverage against expansive monetary policies and persistent inflation.
“After each cycle of decline, bitcoin has reached new all-time highs,” he recalls, reinforcing the long-term BTC bullish narrative.
For now, the decisive signal remains the same: ETF flows. The market will not have solid foundations until redemptions slow down and the 30-day curve shows a clear turn, according to Ecoinometrics.
Until that happens, bitcoin will remain “stuck in a loop,” with bearish pressure remaining high. and a technical structure that has not yet confirmed a recovery.