
The theory of supports and resistances allows us to establish probable zones of lateralization or rebound.
In the medium and long term, bullish expectations for bitcoin continue.
When talking about potential drops in the price of bitcoin (BTC), emotions often run high.
“How are they going to say that?”, “How much do they pay you to write that note?”, “Stop being afraid!”… are some of the frequent comments that can be read on CriptoNoticias’ social networks every time they are posted. publishes some analysis that anticipates price drops.
But the reader should understand that We address these issues not out of sensationalism, but out of responsibility. We know that ignoring the possibility of a fall would be as misleading as claiming that it is inevitable.
Therefore, the present analysis has a single goal: arm our readers with critical information that allows them to make strategic decisions in any market scenario.
Let’s be clear: Discussing the possibility of a drop in the price of bitcoin is neither wishing for it nor causing it.. It is simply recognizing the dynamics of a market that, although promising, is not free of risks.
And what could be coming for bitcoin in the coming hours, days or even weeks? If supply continued to exceed demand, the theory of supports and resistances allows us to establish what the next critical points would be.
Let’s see them in the price chart below, provided by TradingView:
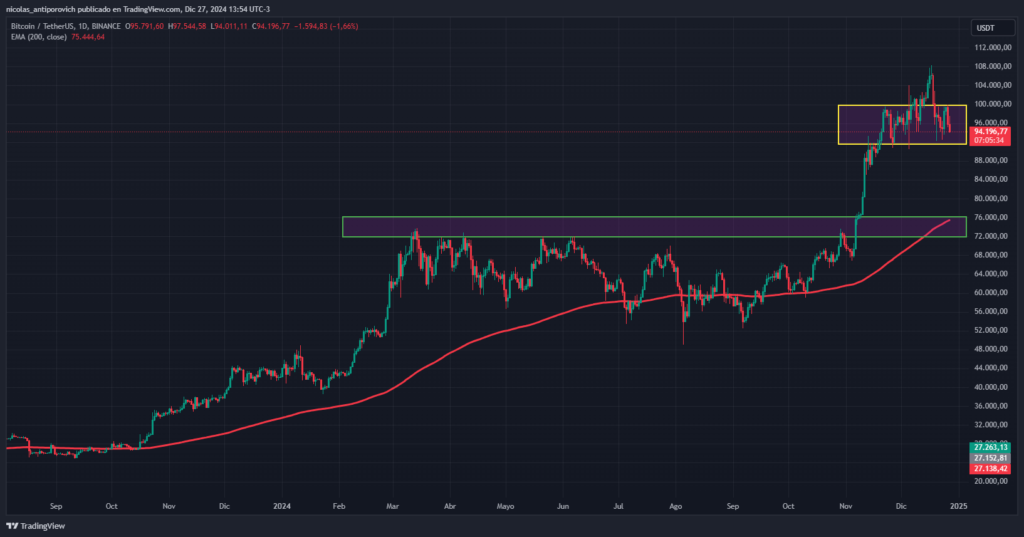
First of all, It would not be strange for bitcoin to remain lateralized for some time longer in the current zone (yellow rectangle), perhaps between approximately $90,000 and $99,000. It appears to be an area where bitcoin “feels comfortable.” The forces of supply and demand are considering that this is the fair price of BTC at the current moment.
But, if supply greatly exceeded demand, bitcoin would not be able to do anything other than drop further in price, in accordance with the laws that determine its price.
If that were to happen, it would be highly likely that BTC to meet the 200-day exponential moving average (EMA) (red curved line), which is an area that usually works like a magnet, attracting the price of financial assets or causing their rebound from there.
At the time of this publication, the 200 EMA is near $76,000but it will change in the coming days (probably with some slight increase).
Note that the 200 EMA is currently coinciding with the area of previous all-time highs, near $74,000. If bitcoin continues to decline, this will probably be an area that will be difficult for you to cross as many investors would consider it an excellent buying area, thinking that it can return to $100,000 and would make a considerable profit.
Something very serious, falling into the black swan category, would have to happen for bitcoin to fall below that price in the near future. At the moment, there are – in general – high expectations for BTC in 2025 and investors do not want to miss out on that predicted price increase.
Why do we talk about support zones and not exact prices?
Technical analysis is a powerful tool, but it is also an interpretive art.
Many analysts talk about support and resistance lines as if they were insurmountable barriers or exact points on the charts. However, the reality of the market is more complex and fluid, which is why here we prefer to talk about “zones” of support and resistance instead of precise lines.
This approach better reflects the dynamic nature of the marketwhere a price range rather than an exact price, often acts as a decision point for investors.
A support or resistance zone is essentially an area where a price range has repeatedly shown the ability to stop price movement down or up. This is because zones incorporate the behavior of multiple market players that may not be active at the same time or at the exact same price, but within a range. For example, while one investor may consider buying bitcoin at $74,500, another might be expecting a further decline to $73,500. This creates a “zone” where buying activity is likely to accumulate.
Disclaimer: The views and opinions expressed in this article belong to its author and do not necessarily reflect those of CriptoNoticias. The author’s opinion is for informational purposes and under no circumstances constitutes an investment recommendation or financial advice.