The futures market shows greater speculative interest.
“Bitcoin is showing a trend towards greater stability,” says Glassnode.
The price of bitcoin (BTC) is giving signals that would indicate a change in trend, according to a report published on April 13, 2026 by the analysis firm Glassnode.
This diagnosis is supported by a series of indicators that reflect an improvement in investor behavior. To support this reading, Glassnode analyzes three key metrics that allow us to understand how capital is moving within the ecosystem.
One of them is the realized capitalization (Realized Cap Change), an indicator that measures whether money is entering or leaving the market.
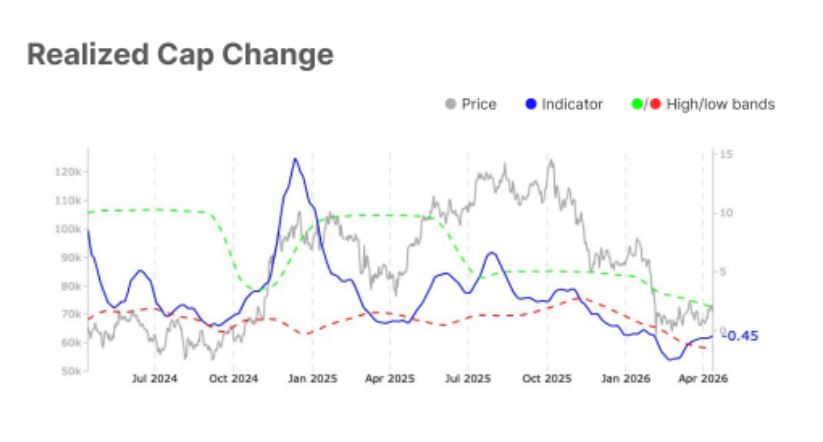
In the graph above you can see that a blue line (representing the indicator) shows an improvement from -0.6% to -0.4%, while the gray line reflects the price of bitcoin. The green and red bands, meanwhile, mark the usual statistical ranges of the indicator.
Although the value is still negative—which indicates that there is still capital outflow— The reduction in that figure suggests that selling pressure is losing strength. For Glassnode, this points to an environment of greater stability in the flow of money within the market.
The other signal appears in the accumulated volume delta (Spot CVD), which measures the difference between aggressive buying and selling in the spot market (spot).
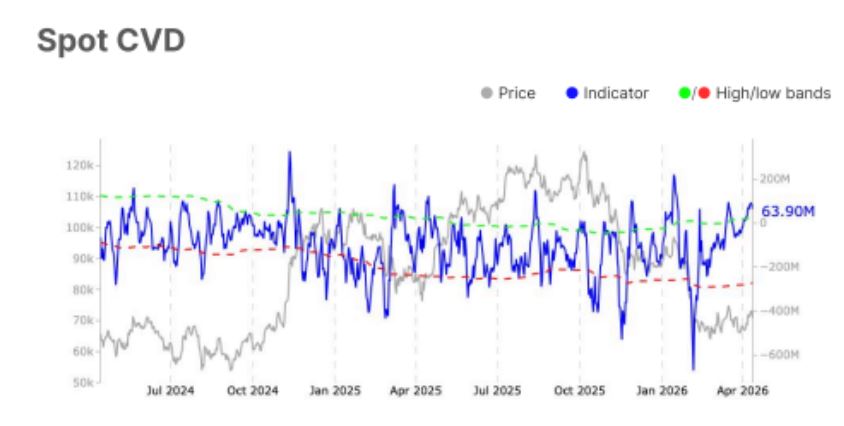
As seen in the graph, the blue line shows a significant jump, going from 34.4 million to 63.9 million dollars, exceeding the upper band of the indicator (marked in green). As in the chart above, the BTC price appears in gray.
This behavior indicates that buyers are dominating the market strongly, reflecting bullish conviction in the short term. Unlike derivatives, this indicator captures real purchases, which reinforces the positive reading of the report.
Finally, Glassnode specialists focus on open interest in futures, which measures the amount of capital invested in BTC derivative contracts.
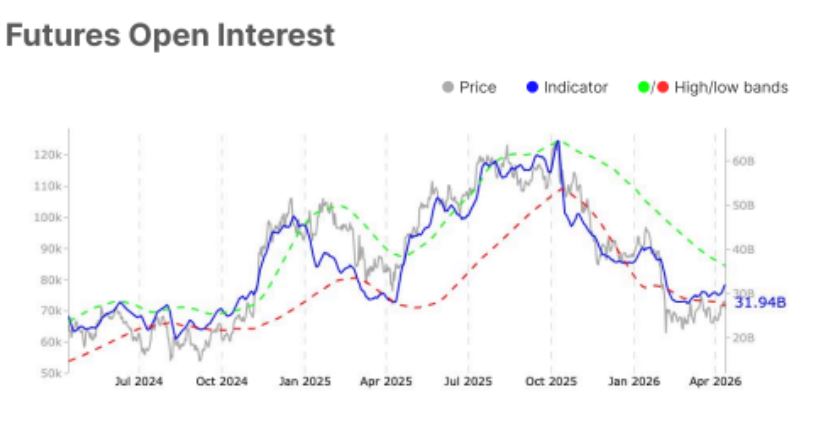
The indicator (also in blue) rises from $29.8 billion to $31.9 billion, an increase of 7.2%. In this case, the value remains within the statistical bands, which indicates that it is not an extreme level, although it does reflect an increase in activity.
For Glassnode, this move signals increased speculative interest and growing participation in the futures market, which can increase price sensitivity to sudden movements.
Together, the three charts show a market in transition. On the one hand, selling pressure is reduced; On the other hand, purchases in the spot market increase; and, at the same time, activity in derivatives grows.
On that basis, Glassnode highlights that BTC “also shows a trend towards greater stability”, in a context in which investors begin to go from selling at losses to taking profits.
This behavior is not minor if the global scenario is taken into account. The war in the Middle East continues to be a factor of tension for traditional markets, especially due to its effect on energy.
As CriptoNoticias has reported, the blockade in the Strait of Hormuz, through which nearly 20% of the world’s oil circulates, and The rise in crude oil, which surpassed $100 per barrel, increased pressure on global assets.
In this context, the fact that BTC maintains demand and activity reinforces Glassnode’s reading: the market is beginning to show signs of recovery, with a more present speculative component.