
For now, there is no strong demand to confirm a sustained price recovery.
An area of strong accumulation and support was formed between $65,000 and $70,000.
Bitcoin (BTC) failed to hold above the $79,000 area and, after that rejection, the market is beginning to look closely at the $68,000 level as key support in the short term.
This is indicated by the report published by analysis firm Glassnode on April 29, which analyzes the behavior of the market between the 20th and 24th of this month based on data in on-chain.
The starting point is in the base cost model of short-term bitcoin investors, that is, the average price at which they purchased their BTC.
In the chart below, the black line represents the price of BTC, while the blue line marks the average cost basis of these investors. The yellow and red curves show areas of greater overheating, and the aqua green line represents a lower cooling area.
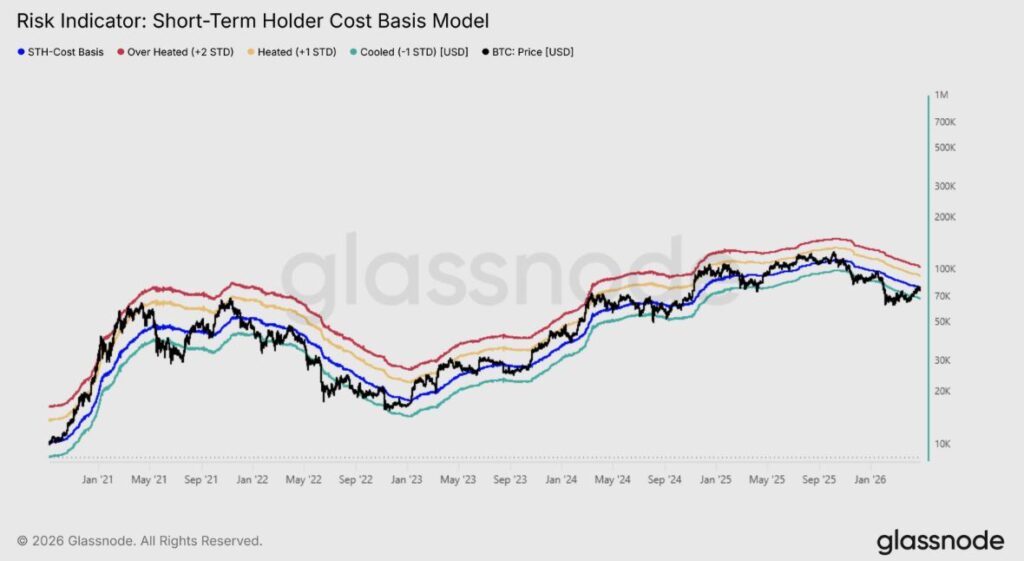
“The price found rejection precisely within this area, failing to stay above the True Market Average at $78,000 and the Base Cost for Short-Term Holders at $79,000,” notes Glassnode.
This behavior confirms a relevant resistance, because many recent buyers reach their break-even point there and tend to sell. That rejection is reinforced by the realized gains graph.
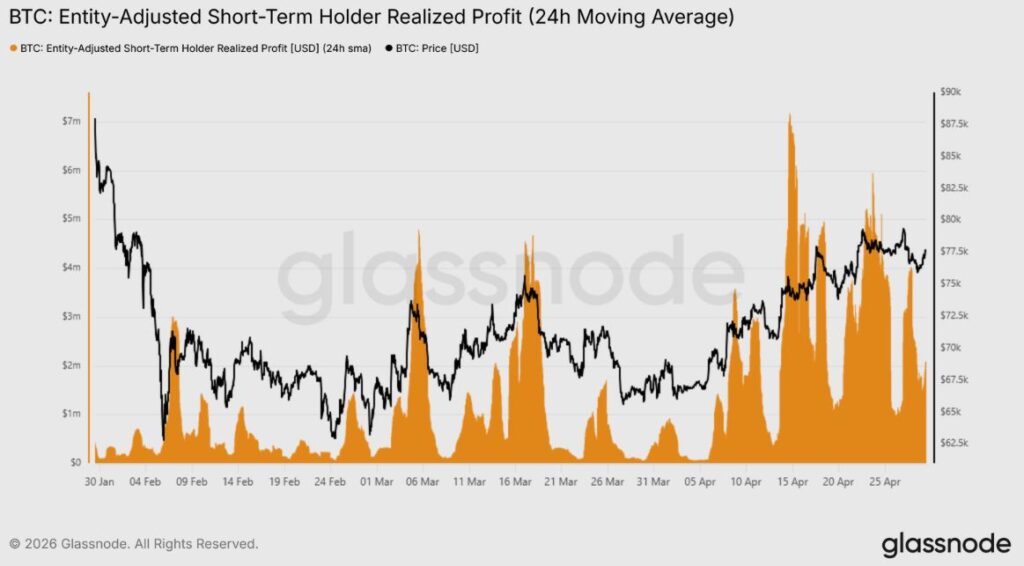
As seen in the image above, the black line shows the price of BTC, while the orange area represents profits taken by short-term holders. Towards the middle and end of April, when the price approached $80,000, the orange area skyrocketed, indicating strong profit taking.
“When the price approached $80,000, this indicator skyrocketed to approximately $4 billion per hour,” the report states.
In simple terms, many recent buyers took advantage of the recovery to sell, and that pressure limited the continuation of the rally.
After rejection, attention shifts to the support zone. The base cost distribution heat map shows where recent purchases were concentrated. The black line represents the BTC price, while the colors on the map indicate concentration of supply: more intense tones show areas where more coins changed hands.
This chart shows a dense band between $65,000 and $70,000. “The dense accumulation that has formed over the past two months between $65,000 and $70,000 reflects a significant degree of confidence on the part of buyers,” says Glassnode.
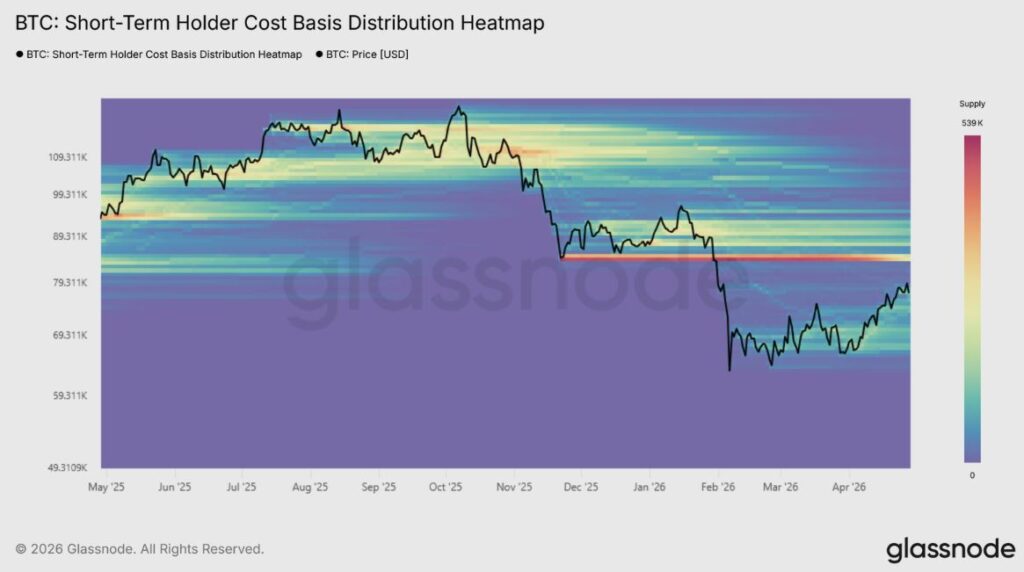
This accumulation turns that range into a support zone, because many investors have their entry price there. Within that area, $68,000 appears as the most important level to watch.
The fourth chart shows the spot volume delta (spot CVD) across all exchanges. The black line represents the price of BTC. Red bars indicate seller predominance, while green bars reflect buyer predominance.
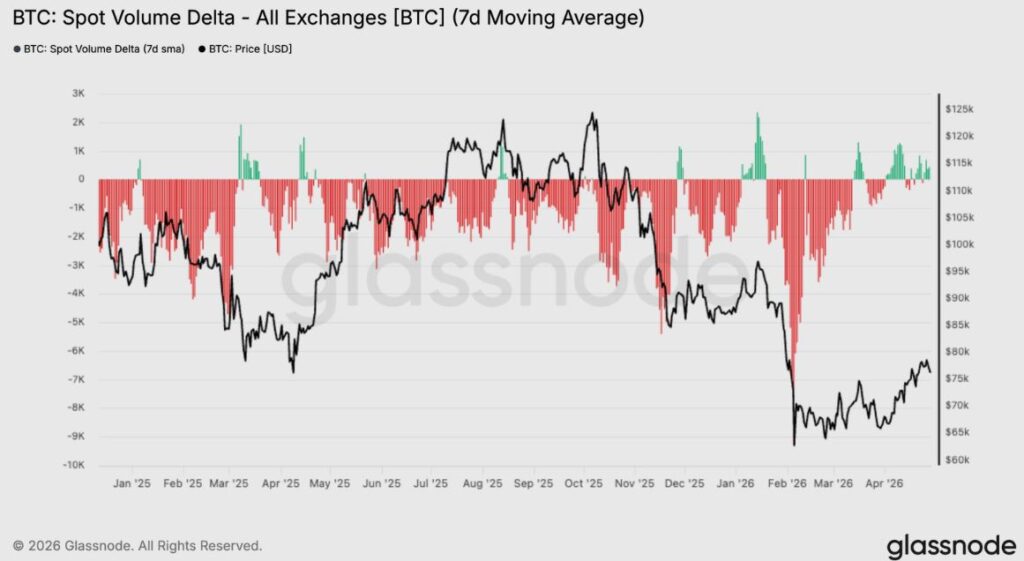
During February and much of March, selling pressure predominated, with deep red bars. However, Towards April the indicator began to approach neutral levels and green bars appeareda sign that selling pressure is moderating.
“Selling pressure is easing, while buyers are re-entering current levels,” the report maintains.
In this sense, the firm’s specialists highlighted that “the market remains trapped below a key resistance”, while the area between 65,000 and 70,000 dollars offers “provisional support.”
The scenario remains fragile. If BTC loses $68,000, the short-term structure could deteriorate. On the other hand, if it manages to hold that area and retest $79,000, the market could interpret the movement as a consolidation before a new bullish attempt.
All of this occurs in a context of growing tension in the Middle East, with a focus on the Strait of Hormuz, a key maritime passage through which nearly 20% of global oil circulates, as reported by CriptoNoticias.
The Strait of Hormuz has been closed since February 28, keeping energy prices under pressure and fueling fears of higher inflation. This context affects the financial markets and also conditions the behavior of BTC.
For now, Glassnode’s reading is cautious: there are signs of stabilization, but still Demand does not appear strong enough to confirm a sustained recovery.