
Bitcoin (BTC) lost the $80,000 level again.
In the short term, the hope is the resolution of the war conflict in Iran.
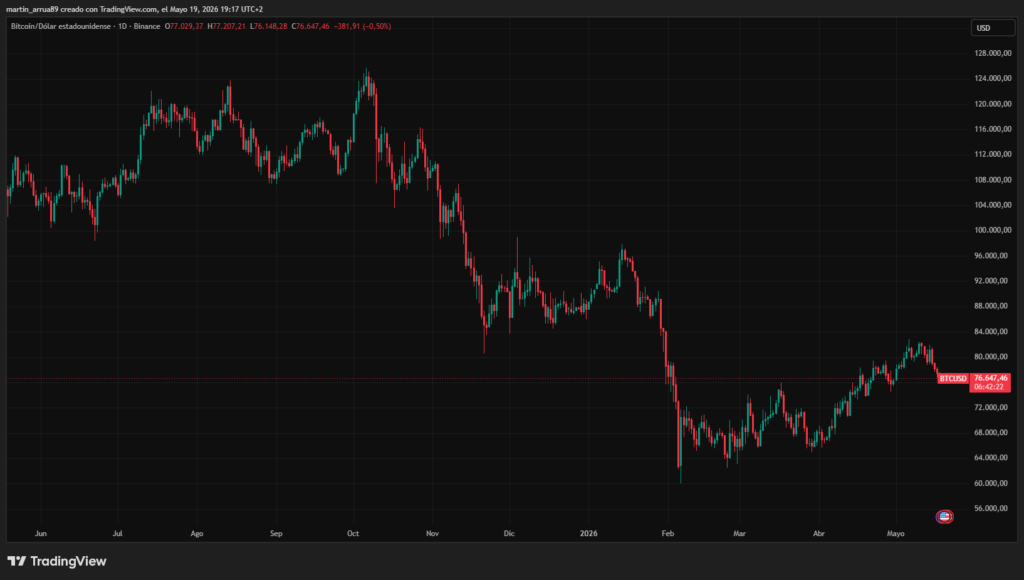
Bitcoin (BTC) once again lost the $80,000 area amid an increasingly adverse geopolitical and macroeconomic context.
At the time of publication of this article, May 19, 2026, the price of bitcoin is $76,640:
This fall has reactivated bearish scenarios that once again place possible objectives near $45,000. These projections had gained strength months ago but, later, with the rise of bitcoin above $80,000, they were forgotten… until now.
Among those who have supported the possibility of bitcoin falling to the $45,000 area are names such as specialists Willy Woo, an on-chain analyst followed by his liquidity metrics, and No Limit Gains, a trader and founder of The Assembly, a private investment community focused on macroeconomic analysis, market research and long-term portfolio construction.
Even Michaël van de Poppe, one of the most bullish analysts in recent weeks, changed its position and now warns of risks of new falls.
No Limit Gains revives the USD 40,000 scenario
The idea of a deep fall is not new. The No Limit Gains trader had already raised on December 16, 2025 that BTC would likely bottom out near $40,000 this year. “BTC has a habit of humiliating people just when trust is strong,” he wrote then.
As he explained, bitcoin cycles are usually crossed by the halving, the scheduled event that reduces the issuance of new coins by half approximately every four years (and whose most recent edition was in 2024).
For the trader, after that narrative drives a bullish phase, the market attracts leverage, late buyers and overconfidence. “Bitcoin moves in a four-year cycle, driven by liquidity, leverage and human behavior. Not by vibes or euphoria,” he said.
In the weekly chart that accompanied his analysis, the trader projected a drop towards the $40,000 region.
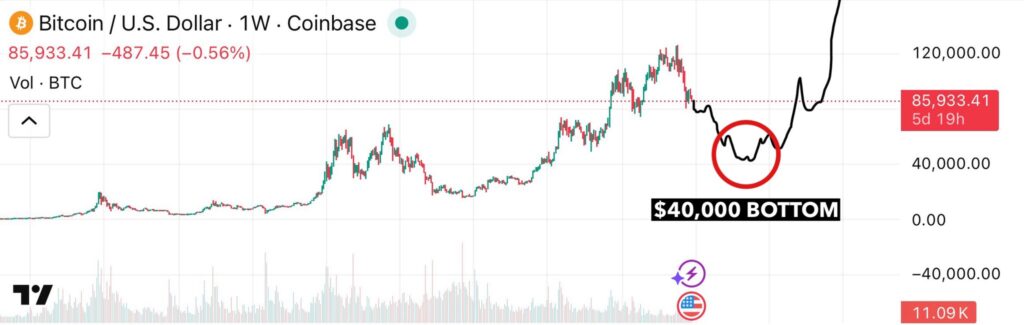
The black line drawn on the graph represents precisely that scenario: a deep capitulation followed by a progressive recovery towards new all-time highs. “It would be the restart that prepares the next massive run,” he added.
Willy Woo had already warned of a weakened structure
The possibility of a prolonged bear market had also been anticipated months ago by Willy Woo, an on-chain analyst specializing in liquidity and capital flow metrics.
In February 2026, Woo pointed out that the liquidity of the spot market (direct purchase and sale of bitcoin) and the futures market (derivative contracts where traders bet on the future price of the asset often using leverage) showed an unusual simultaneous deterioration.
“I have never seen bitcoin rise when both sources of liquidity are bearish,” he noted.
Woo maintained that if the macroeconomic context worsened, The area near $45,000 could become “a typical bear market low.”
Bitcoin is in a key technical zone
Other technical reading The most recent is that of Rajat Soni, CFA and financial analyst specialized in bitcoin, who on May 17, 2026 shared a graph with the price of the asset appearing within an ascending channel. According to his thesis, That structure had been functioning as support since March.
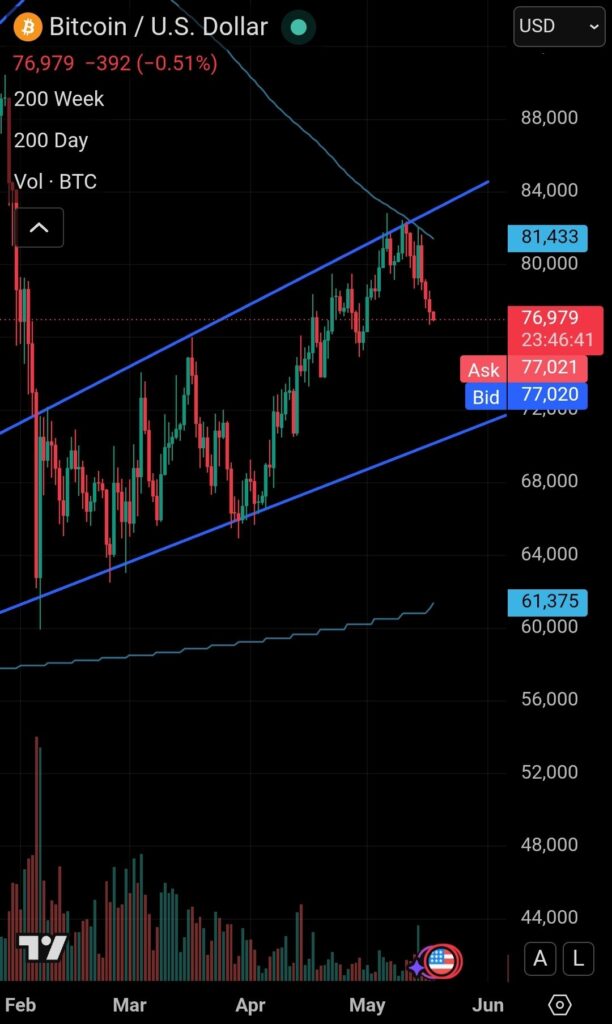
The price fell towards the lower part of that channel, near $77,000, while the 200-day moving average appears above the price and acts as resistance, that is, an area where sellers historically tend to appear and the price finds it difficult to continue rising.
Instead, the base of the channel functions as support, an area where demand typically arises and the price tends to stop declines. Yes BTC loses that structure, the market could accelerate the correction towards lower support zones.
Soni, however, clarified: “I don’t think bitcoin will ever reach $40,000 again, but if it does, I would gladly buy as many sats (satoshis) as I can,” he said.
Van de Poppe changes his bullish stance
The recent deterioration of the market also modified the position of Michaël van de Poppe, a Dutch trader who until a few days ago projected bullish continuity. “Bitcoin is not looking good. Far from it,” wrote this May 19 in his X account. His publication is accompanied by a price graph of the digital asset.
In this chart, Van de Poppe shows that BTC lost an important support structure around $79,000. The horizontal blue line identifies a “gap” pending the CME (Chicago Mercantile Exchange), the largest regulated financial derivatives market in the United States where bitcoin futures are also traded.
That “gap” represents a quotation gap generated when the traditional market remains closed during the weekend, while BTC continues to operate on exchanges open 24 hours a day. Many traders consider these gaps relevant, from a technical point of view, because the price usually returns to “fill” them later.
Below appears a green area marked “crucial area to hold“, that is, a critical area of support that should be sustained to avoid a downward acceleration. The analyst warns that if BTC does not quickly recover the $79,000 region, “we will most likely cascade” towards levels below $65,000.
Furthermore, Van de Poppe highlighted that the macroeconomic context continues to deteriorate: “Oil continues to rise, Brent currently trading at $107. Yields are rising again.” He added: “None of these are favorable for risk assets (including BTC).”
The conflict in Iran puts pressure on the market again
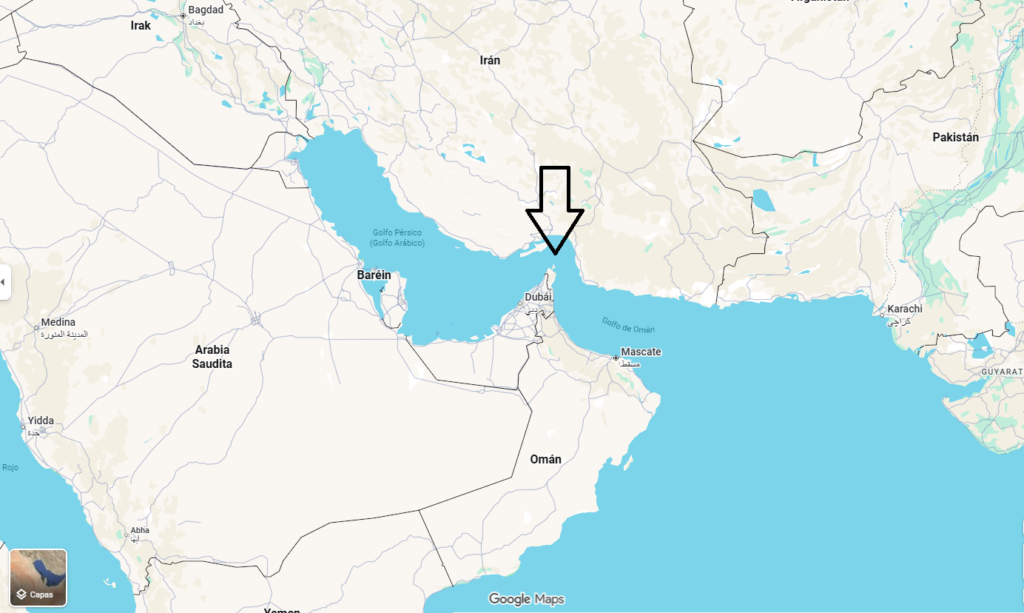
As CriptoNoticias has explained, war tensions in the Middle East are negatively affecting BTC. Since February 28, the day the United States and Israel attacked Iranian soil, the Strait of Hormuz remains practically blocked. It is a critical maritime passage through which nearly 20% of the world’s oil circulates.
The partial reduction in energy flow raised international oil prices and increased global inflation expectations.
This phenomenon has direct consequences on BTC and cryptocurrencies. If inflation remains high, central banks like the Federal Reserve (FED) have less room to reduce interest rates.
With high interest rates, The cost of money increases and the liquidity available for speculative investments decreases.
The ceasefire, bullish hope for bitcoin
In the short term, a good part of the bullish expectations now depend on an eventual de-escalation of the conflict between the United States and Iran.
A ceasefire or a diplomatic solution that allows transit in the Strait of Hormuz to normalize again could ease pressure on oil and improve risk appetite in financial markets.
In addition, investors remain attentive to Kevin Warsh’s first statements as head of the FED. Any favorable signal on monetary policy or liquidity could help stabilize the market after several consecutive days of bearish pressure on BTC.