
Rand Group says the model “has been extremely accurate.”
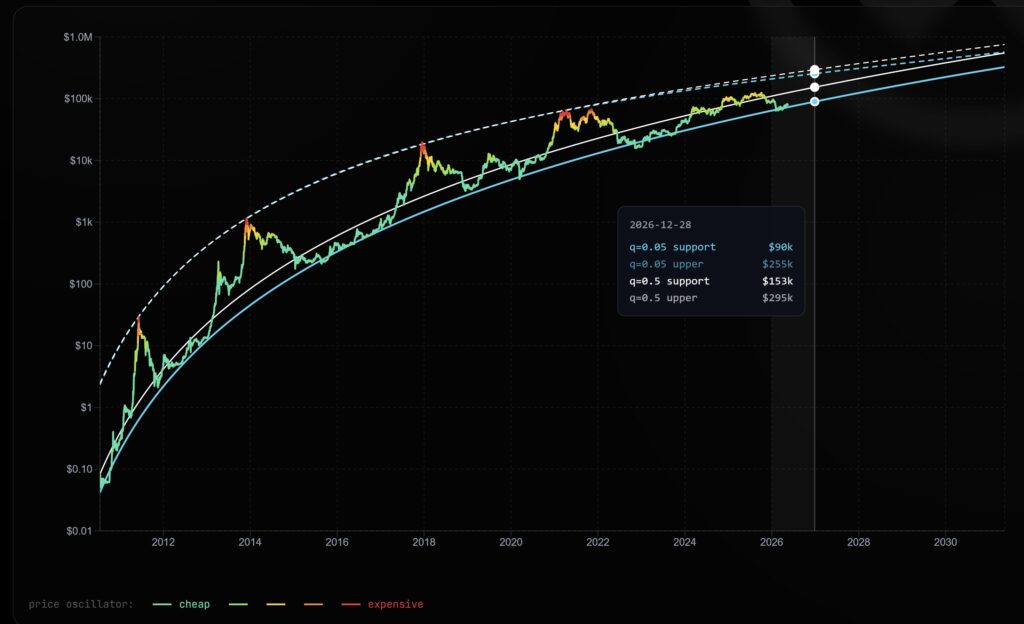
In the most pessimistic case, bitcoin would trade at USD 90,000 in December 2026.
The bitcoin (BTC) decay channel, a statistical metric created by the analyst who identifies himself as Sminston With and who has accurately anticipated previous highs and lows for the digital currency, projects an average price target of $153,000 by the end of 2026. This estimate represents the midline of support or equilibrium point of the mathematical model for the end of next year.
Sminston With explains that this tool “offers a fairly reasonable range” to measure the market. For its part, Rand Group, a financial analysis and consulting firm affirms that the decay model “has been extremely accurate over the past 14 years” in regulating performance expectations. For example, this model has forecast bitcoin falling slightly below $20,000 in the previous bear cycle.
The principle behind this model is that the speed and magnitude of bitcoin profits decay with each cycle. The asset maintains a long-term macro-bullish trendbut its returns are reduced after each halving, the event that reduces the issuance of new BTC coins by half.
For example, going from $0.10 to $100 per BTC required a much smaller capital injection than needed to move the price from $10,000 to $100,000. The model fits its curves assuming that each subsequent bull market will be percentage-wise less aggressive than the previous one. Instead of projecting infinite exponential growth, the channel bands gradually flatten into the future.
For the end of 2026, the model calculates reference values based on different quantiles (q) or statistical measures of position, as seen in the following graph. The 0.05 quantile establishes the strictest lower support or safe floor zone at $90,000 in case of a conservative-bearish scenario.
Sminston With –.
The intermediate projection, corresponding to the 0.5 quantile, places the balance point at the aforementioned $153,000. Above this value, the upper 0.05 quantile marks an intermediate resistance of $255,000, while the upper 0.5 quantile sets the maximum ceiling at $295,000.
In the longer term, the indicator extends its bullish estimates for the following maturation periods. The bands’ projections move between $128,000 and $308,000 by the end of 2027, maintaining the decelerated growth curve.
Despite these optimistic mathematical projections, There are market operators with much more cautious positions. No Limit Gains, trader and founder of the investment community The Assembly, has exposed bearish scenarios that place possible objectives near $45,000, as reported by CriptoNoticias.
“Bitcoin moves in a four-year cycle, driven by liquidity, leverage and human behavior. Not by vibes or euphoria,” said the founder of The Assembly. His position reminds us that deep corrections are part of the normal behavior of the market.
Sminston With emphasized that “tools like these help avoid buying in bubbles,” preventing the investor from acting out of excessive enthusiasm. The analysis of historical data allows us to understand that the current declines fall within the normal maturation parameters of the digital asset. “For comparison, bitcoin was at $43,000 in December 2023,” the analyst recalled to illustrate long-term growth.
The use of statistical models offers insight into managing financial risk in a volatile market. In the end, understanding that percentage returns decrease over time helps you set realistic investment goals based on data rather than speculation.