
Willy Woo notes that the downtrend could continue until after June.
“I would expect $60,000 to be tested,” says Michaël van de Poppe.
Bitcoin (BTC) fell below $73,000 on May 28, 2026, amid growing global risk aversion due to the war between the United States and Iran.
At the time of publishing this article, bitcoin is trading at $73,263, 41.9% below its all-time high (ATH) of $126,198:
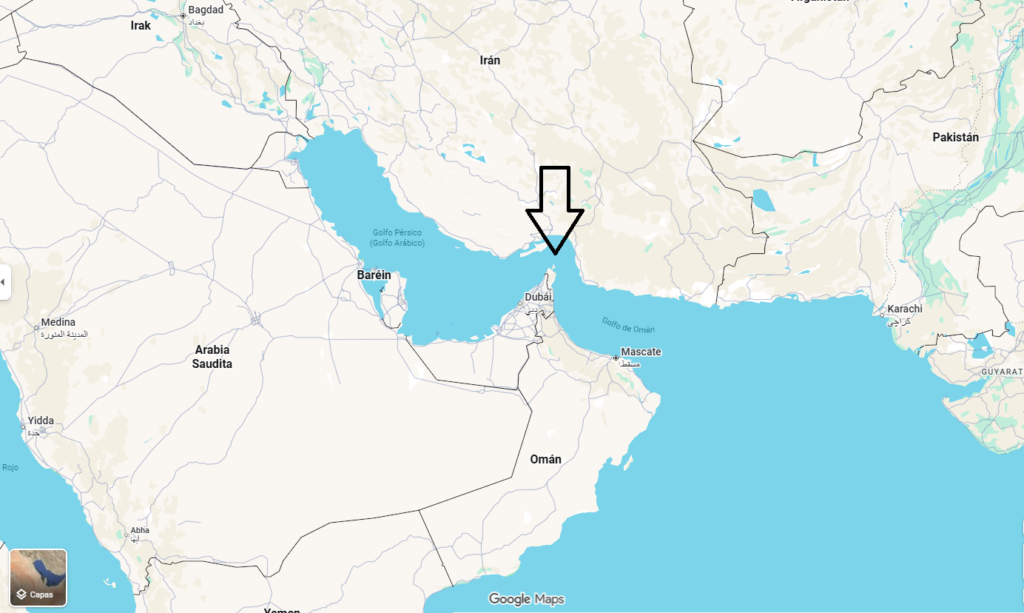
This occurs due to the continuity of the war conflict in the Middle East that began on February 28, which keeps the markets in suspense due to the blockade of the Strait of Hormuz. a strategic maritime route through which—in normal situations—close to 20% of the oil transported by sea in the world circulatesas explained by CriptoNoticias.
The restrictions and threats on that corridor increased pressure on energy prices and They revived fear of a new global inflationary shock.
This macroeconomic deterioration is hitting assets considered risky, including technology stocks and bitcoin, while investors seek refuge in more conservative instruments in the face of an increasingly uncertain international scenario.
In this context, different traders and analysts began to project bearish scenarios for BTC, although with important differences regarding the depth and duration of the correction.
For Willy Woo, “the lateral structure is still valid”
Professional trader and market analyst Willy Woo maintains that, despite the recent drop, BTC has not yet confirmed a structural collapse.
“Risk goes down a bit” and “flows into the network remain fairly neutral,” Woo wrote on May 28 on his X account. The publication is accompanied by the “macro cycle risk model” graph (Macro Cycle Risk Model).
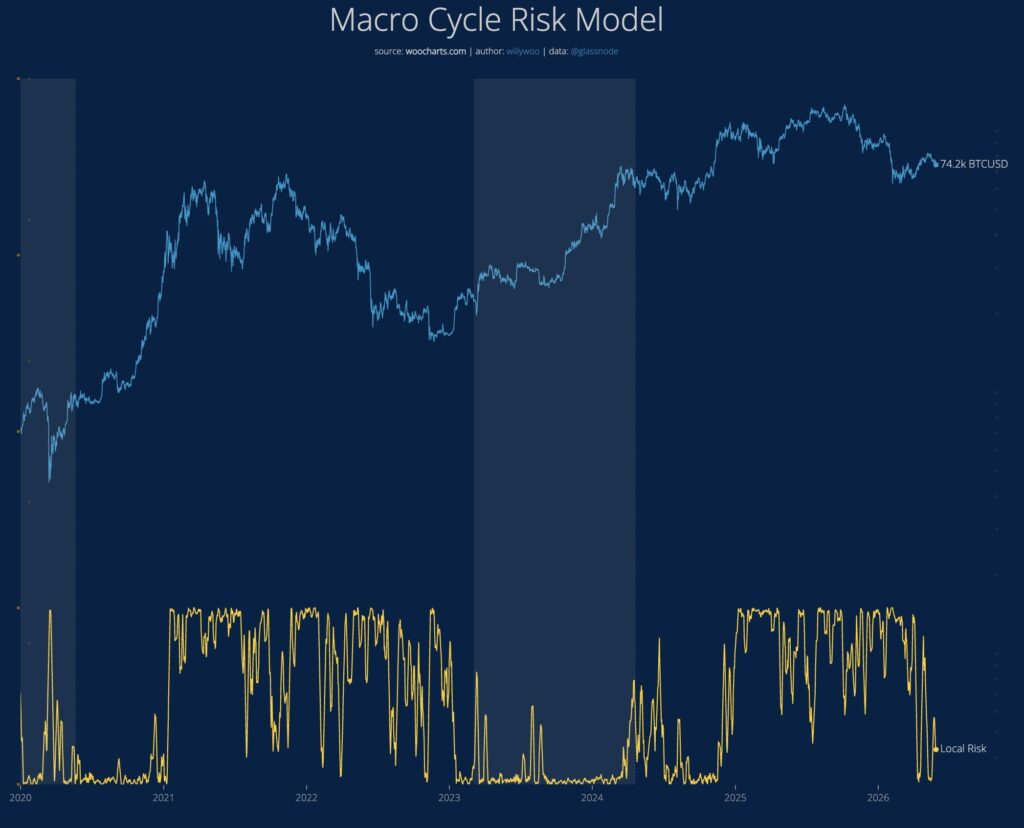
The graphic shared by Woo combines two main elements. The top blue line represents the price of BTC from 2020 to present. Below it appears a yellow line called “local risk” (local risk), which measures the level of market risk according to variables linked to liquidity and behavior on the network.
The vertical gray zones mark periods where BTC historically went through stages of low relative risk before new relevant market movements. According to Woo, the indicator returned to low levels or “neutral territory,” something that for him suggests that “the lateral structure is still in force.”
However, market analyst detects negative signal outside the BTC market. “I am also reading a sign of bullish trend exhaustion in the equity market,” he warned.
With that phrase, Woo means that the shares could be losing strength after a period of increases. That is to say, It does not necessarily anticipate an immediate decline, but it does anticipate a possible loss of momentum in traditional markets. For this reason, he added: “If it comes to fruition, BTC could continue a downward trend after June.”
The trader clarifies that this signal “is not anchored in data on the real behavior of investors,” which is why he considers it less reliable than the network metrics he usually uses to study BTC.
Van de Poppe: “I would expect USD 60,000 to be tested”
More bearish was the trader Michaël van de Poppe, who consider that bitcoin has not yet finished correcting. To support his thesis, he shared a price chart of the asset that shows several relevant technical zones.
As seen in the previous image, the green and red candles represent the daily price movement, while the blue line works as a trend moving average.
The upper red zone, marked as a critical area to break (crucial area to break), appears near $76,600 and represents a key resistance that BTC failed to overcome.
Above appears another technical reference called “CME Gap”, located near $79,000. A CME Gap is a price gap that is generated in bitcoin futures listed on CME, the Chicago derivatives exchange, when the price opens at a different level than the previous close.
This is important to point out because many traders look at these gaps because, historically, the price tends to return to those areas.
Van de Poppe explains that “BTC rejected the $77,000 area and was unable to break that level.” “This rejection accelerated the downward momentum,” he said.
For the trader, the current fall responds to typical end-of-month factors within the financial markets. “The standard approach is developing here: in the final days of the month, markets correct as rebalancing occurs among asset managers,” he noted. And he added: “That is why this cooling is happening in BTC.”
For him, the current zone represents “the last stance of an important support zone.” If that level is lost, the scenario could deteriorate quickly. “Otherwise, I would expect the lower $60,000 to be tested for support,” the trader said.
In technical analysis, a support is an area where historically sufficient buying demand appears to stop or moderate a fall. That is, Van de Poppe considers that, if BTC loses the current area, The market could only look for buyers in the low area of $60,000.
Crypto Rover: “All hell will break loose”
Much more aggressive was the trader Crypto Rover, who consider that BTC has already activated a clearly bearish structure.
According to the analyst, BTC began to break a “head and shoulders” technical pattern, a formation that is usually interpreted as a sign of bearish continuation.
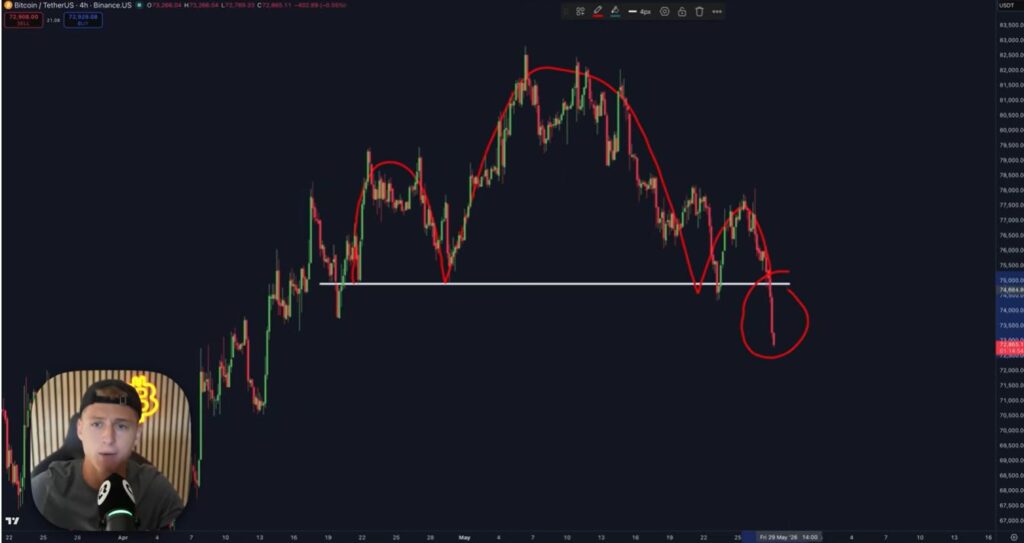
“The big BTC crash is happening right now,” he stated, while adding: “We are starting to break this head and shoulders pattern.”
This pattern is formed when the price makes three peaks: a first high, then a higher peak (the “head”) and then another lower high. The area that joins the lows between these peaks is known as the “neck line.”
If the price breaks that line down, Many traders interpret that the trend has lost strength and a decline may accelerate. “The moment we break this exact level, literally all hell will break loose on BTC,” he warned.
Crypto Rover even projects much deeper scenarios for the price. “I would expect targets between $45,000 and $60,000,” he said.
According to the analyst, bitcoin continues to replicate typical patterns of previous bear markets. “In every bear market, bitcoin consolidates up and then breaks down,” he explained.
Even so, the trader maintains that a sharp drop could also represent a long-term accumulation opportunity. “I want bitcoin to return to that region because I want to accumulate aggressively there,” he said.
Meanwhile, the market remains extremely sensitive to any developments linked to the Middle East. An eventual reopening of the Strait of Hormuz or concrete signs of military de-escalation could temporarily relieve pressure on risk assets.
But if the conflict continues to worsen and global inflationary tensions increase, Volatility will likely continue to dominate bitcoin’s behavior in the coming weeks.