
$60,000 will be the next strong support that bitcoin would face.
“Bitcoin at $45,000 would be a typical bear market low for bitcoin,” says Willy Woo.
The price of bitcoin (BTC) on the morning of this Friday, June 5, 2026 is close to $62,400. Thus, the digital currency is approaching its lowest level of the year—at least, so far—which was $60,000 and was reached on February 6.
The following graph shows How the bitcoin price has behaved during the current year:
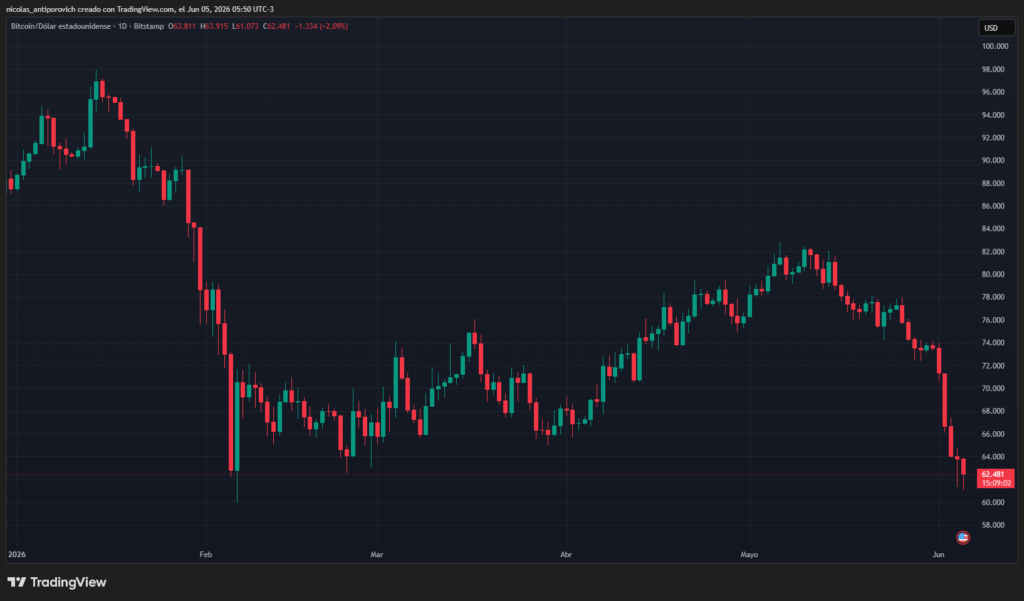
Due to the fact that it has functioned as support in the past, it is very likely that $60,000 will once again fulfill this function for bitcoinserving as a “brake” for the price and stopping – even momentarily – its fall.
But what would happen if bitcoin manages to break this support downwards? So, according to the same theory of supports and resistances (which is explained in detail in the Criptopedia, educational section of CriptoNoticias) bitcoin would have a high probability of heading towards other areas that in the past also functioned as supports and resistances.
let’s do it zoom out to the bitcoin price chart to see what these key price levels could be:
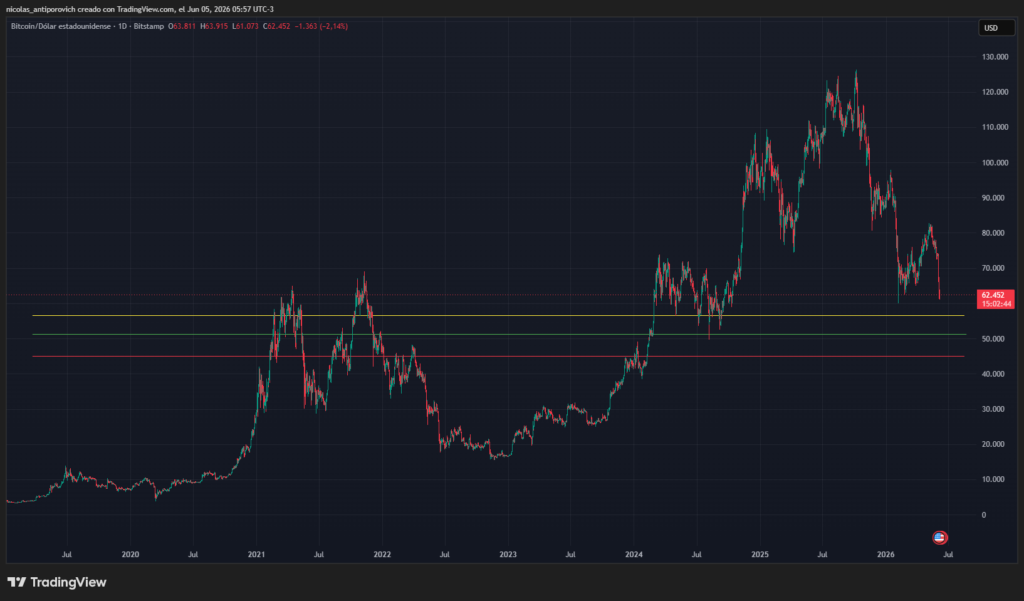
In the graph above there is 3 key price zones. Note the use of the word “zone” which refers to relatively large areas and not exact prices. This is because the supports and resistances are not repeated with millimetric accuracy, but are prices around which the asset would tend to stop its fall, repeating historical patterns.
We would probably find the first of these areas near $56,000 (yellow horizontal line). In the graph you can see that the price of bitcoin has bounced and lateralized quite a bit around that price in the bullish cycle of 2021. It also served as support in the lateralization that bitcoin showed at the beginning of 2024.
And, if the digital currency continued its decline, it would possibly find a new brake near $50,000 or $51,000 (green horizontal line). That price has served as resistance in September and December 2021. And it was also a support zone for bitcoin in August 2024, shortly before the great bullish rally began that took bitcoin above $100,000 for the first time.
But, if that weren’t enough of a drop, bitcoin would find support again, most likely around $45,000 (red horizontal line). As seen in the chart above, it is a price area in which bitcoin lateralized in early 2022 and early 2024.
Furthermore, CriptoNoticias has reported that according to Several analysts and traders – including, for example, Willy Woo – bitcoin would have a high probability of going to $45,000 as a minimum point in this bear market. They are based on historical analysis and percentage comparison of how much the price of the digital currency has fallen in each crypto winter.

It is worth clarifying, of course, that the price of bitcoin does not depend only on technical analysis and the lines drawn on a price graph.
The price of the currency created by Satoshi Nakamoto is greatly influenced by the global macroeconomic context. If there was good news as a peace agreement in the Middle East that would free the Strait of Hormuz, bullish sentiment will most likely return to the market and, perhaps, bitcoin is not going to look for the bearish levels mentioned here.
But, the reality is that that good news does not exist for now, the feeling is mostly negative and extreme fear (according to CoinMarketCap’s fear and greed index) and this causes investors to withdraw their money from bitcoin and cryptocurrencies, causing further falls.
This text is written for informational purposes. It does not constitute an investment recommendation or financial advice. Each investor is responsible for conducting his or her own research.