
Bitcoin shows mixed signals in the market, in a context marked by geopolitical tension in the Middle East.
This is clear from the most recent report published today, April 20, 2026, by the analysis firm Glassnode, which identifies a combination of buying interest with increasing signs of bearish pressure.
According to the report, which analyzes the movements of bitcoin during the week of April 13 to 17, bitcoin maintains a solid demand base, although with signs of deterioration in the short term. “Despite a slight decline in bullish price momentum, the market still shows strong buying interest, which could cushion significant declines,” notes Glassnode.
However, this reading coexists with indicators that point in the opposite direction. One of those that stand out Glassnode analysts is the cumulative volume delta (CVD), which shows a turn towards the sell side.
This indicator that measures the difference between executed buy and sell orders. In simple terms, it allows you to identify which side (buyers or sellers) is dominating.
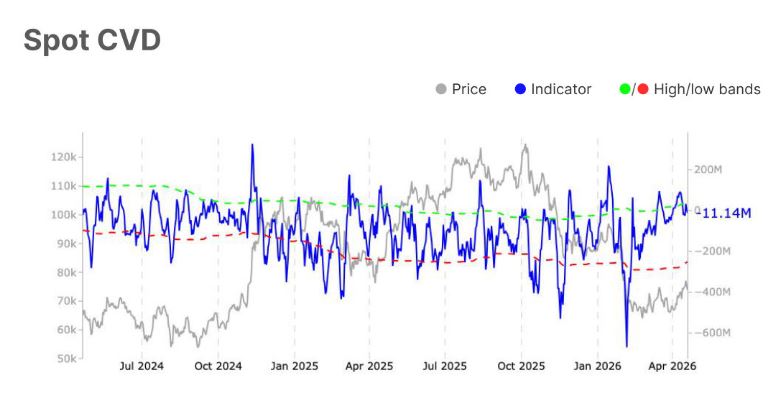
On the chart, the blue line represents the CVD, while the gray line shows the price of bitcoin. The move of the CVD to negative territory, visible in the final stretch, indicates that sell orders are exceeding purchase orders, reflecting a dominance of sellers in the short term.
The data is key because it suggests that, although there is interest, sellers are taking control in the short term.
Futures: more risk, but with a bearish bias
In the futures market, the outlook also shows tensions. On the one hand, open interest continues to grow, indicating greater risk exposure. But, at the same time, The financing of long positions (traders who bet that the price will rise) has deteriorated.
As seen in the previous graph, the blue line represents the financing rate (funding rate), while the gray line corresponds to the price. Glassnode notes that “the long-side funding payment has fallen significantly to $1.8 million, marking a 315% drop.” This movement towards negative values implies that traders are paying to hold short positions (shorts), suggesting a bearish bias or greater caution.
In contrast, US BTC exchange-traded funds (ETFs) continue to show strength. “Weekly net flow has increased to $553.9 million, compared to the previous $251.7 million,” the report indicates.
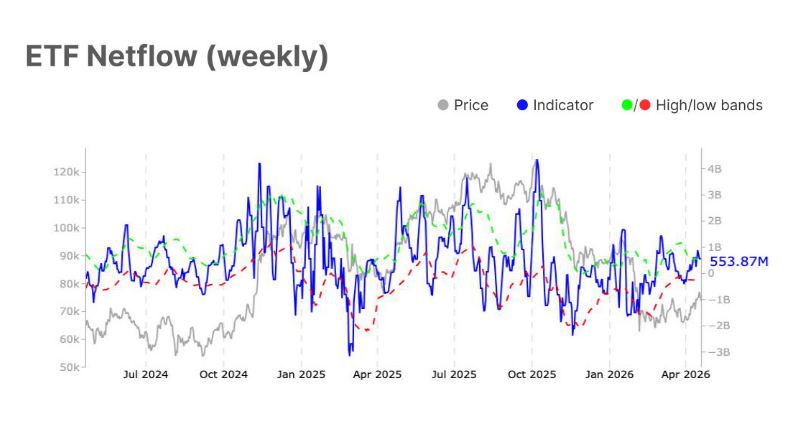
On the chart, the blue line represents capital flows into the ETFs, while the gray line shows the price. The sustained rise of the blue line indicates capital inflows, which “highlights bullish sentiment among institutional investors” and suggests greater interaction with BTC through regulated channels.
For its part, the options market provides another relevant signal. The open interest (open interest), which measures the total number of active options contracts that have not yet been closed, fell to $28.2 billion.
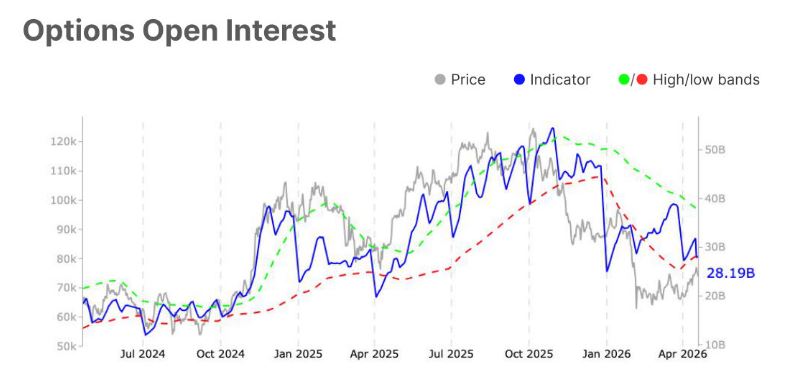
On the chart, the blue line represents the open interest, i.e. the total open contracts, while the gray line shows the price. According to Glassnode, this drop “suggests a significant reduction in participation or speculative demand.” This may indicate taking profits or closing positions, which could impact future market volatility.
Signs of stabilization
Beyond derivatives markets, Glassnode identifies mixed signals in the liquidity structure. The decrease in hot capital and stability between short- and long-term holders suggest caution, but not a massive exit from the market.
In this context, the report highlights the evolution of net unrealized profit/loss (NUPL), a metric that measures the level of latent gains or losses in the market in relation to the acquisition price.
Improvements in the NUPL indicate that a greater proportion of investors is back in profits, which is usually associated with stabilization phases. However, Glassnode warns that “a drop in the realized profit/loss ratio points to fear-driven selling,” which keeps the pressure on in the short term.
The bitcoin market is going through a moment of unstable equilibrium. While ETFs and open interest maintain a moderately optimistic bias, indicators such as CVD and funding rate reflect increasing bearish pressure.
All this occurs in an uncertain geopolitical context, aggravated by the escalation between Iran and the United States, where the market faces new tensions. The blockade of the Strait of Hormuz, a strategic route through which nearly 20% of the world’s oil circulates, adds additional pressure, as reported by CriptoNoticias. The resolution of this conflict will be decisive in defining the next movement of the BTC price.